
Anticipating Consumer Sector Shifts: TickerTrends vs. YipitData vs. M Science
How TickerTrends Spots Consumer Inflection Points Ahead of Transaction Data

In today’s data-driven market, investors are increasingly leveraging alternative data to spot changes in consumer behavior before they show up in company financials. Alternative data – from credit card swipes and e-receipts to web traffic and social media trends – can reveal inflection points in consumer demand that traditional analysis might miss. Platforms like YipitData, M Science, and TickerTrends have emerged as leading sources of these insights, each with a distinct approach. This article explores how TickerTrends anticipates shifts in the consumer sector using transaction and alternative data, and compares its strategy to YipitData’s transaction-focused analytics and M Science’s multi-source research. We’ll also delve into a case study on Duolingo (DUOL), illustrating how TickerTrends signaled a change in momentum before or alongside other providers.
YipitData: Transaction Insights for Consumer Trends
YipitData has built a strong reputation for mining consumer spending data to predict key performance indicators (KPIs) in retail, e-commerce, and other consumer industries. The company gathers and analyzes aggregated transaction data – including millions of credit card purchases, email receipts, and other payment information – to help investors spot sales trends ahead of official earnings reports blog.tickertrends.io. By tracking how much consumers are spending and where, YipitData can produce near real-time estimates of metrics like a retailer’s quarterly revenue or a streaming service’s subscriber growth before the company announces them publicly blog.tickertrends.io. This transaction-driven approach offers a granular, up-to-date view of business performance that can reveal shifting momentum in consumer behavior.
The strength of YipitData’s platform lies in its focus on consumer sectors where purchase data is plentiful. For example, by monitoring swipes and receipts across thousands of shoppers, YipitData might detect an upswing in spending at a particular retail chain or a surge in food delivery orders that foretell a company’s revenue beat. In one instance, a hedge fund used YipitData’s early read on a spike in holiday e-commerce spending to adjust its positions – a move that resulted in a 12% boost to that season’s returns blog.tickertrends.io. YipitData’s detailed dashboards and analyst reports, which integrate transaction data with web analytics and even public data, give investors a data-driven view of which companies are gaining or losing momentum blog.tickertrends.io. This transaction insight can translate to alpha by uncovering consumer spending shifts faster than traditional channel checks or management guidance.
However, YipitData’s transaction-centric model also defines its limits. It excels in areas where consumer purchase signals exist (think retail sales, online shopping carts, app subscriptions), but is less applicable to sectors without direct consumer payments blog.tickertrends.io. For instance, it can reliably project retail same-store sales or app subscriber counts, but it may have gaps analyzing industries like enterprise tech or B2B services where credit card data is scarce blog.tickertrends.io. Still, for consumer-focused investors, YipitData remains a go-to source. Its ability to turn receipts and swipe data into early indicators – such as highlighting a surge in spending or a slowdown in foot traffic weeks before earnings – makes it a powerful tool for identifying inflection points in consumer trends and positioning ahead of the crowd blog.tickertrends.io. In summary, YipitData leverages what consumers have done (their actual purchases) to forecast company performance, providing high-confidence signals for near-term trend changes in the consumer sector.
M Science: Multi-Source Analytics and Curated Research
M Science takes a broad-based approach to alternative data, blending many data sources and delivering insights through curated research. As one of the pioneers in the alt-data industry (with roots stretching back two decades blog.tickertrends.io), M Science aggregates everything from anonymized credit card transactions to web traffic, mobile app usage stats, and even social media mentions blog.tickertrends.io. The idea is to provide a holistic view of a company’s performance by triangulating multiple signals. Rather than rely on a single dataset, M Science’s team tests and validates numerous data streams, then zeroes in on the ones that prove most predictive for a given company or KPI blog.tickertrends.io. The result is often a mosaic of insights: for example, integrating e-commerce sales estimates, Twitter sentiment, and app download trends to forecast how a consumer tech company’s quarter is shaping up blog.tickertrends.io. By combining these disparate sources – transactional, web, and social – M Science aims to see the “full picture” of consumer behavior shifts and identify subtle inflection points that any one dataset might miss.
A hallmark of M Science’s offering is its analyst-driven research reports and dashboards. Their analysts distill the raw data into actionable narratives, often blending alternative data with traditional financial analysis blog.tickertrends.io. This can surface trends that aren’t obvious from financial statements alone. For instance, M Science might publish a report that merges credit card spending data, social buzz, and web traffic to predict an upcoming surge for a retail or internet company. In fact, one hedge fund credited M Science’s blended data for tipping them off to an impending sales beat at a leading tech retailer: M Science’s analysis showed heightened consumer interest and increased purchasing on the retailer’s platform, signaling the company would likely beat expectations. Acting on this early insight, the fund bought in ahead of earnings – and the stock jumped when the beat materialized blog.tickertrends.io. This example underscores how curated multi-source analytics can connect the dots between consumer buzz and actual sales, yielding profitable trades for those who anticipate the inflection.
M Science’s expansive coverage across industries and data types comes with the benefit of breadth, but also some complexity. Users have to navigate large volumes of information – parsing everything from app usage stats to sentiment scores – which can be a steep learning curve blog.tickertrends.io. The platform mitigates this by providing consultation and support, helping funds interpret the data correctly blog.tickertrends.io. And despite the firehose of data, M Science understands that timing is vital: delivering insights quickly, before the market has figured it out, is core to its value blog.tickertrends.io. In essence, M Science leverages what consumers are doing and saying across many channels, then curates those signals into a cohesive story. This multi-source approach often allows it to catch shifts in consumer momentum (whether a positive uptick or a negative slowdown) early on. For hedge funds and analysts who want depth and corroboration – a way to double-check a trend via several angles – M Science provides a rich, if complex, avenue for alternative data-driven alpha.
TickerTrends: Early Trend Detection via Search and Social Signals
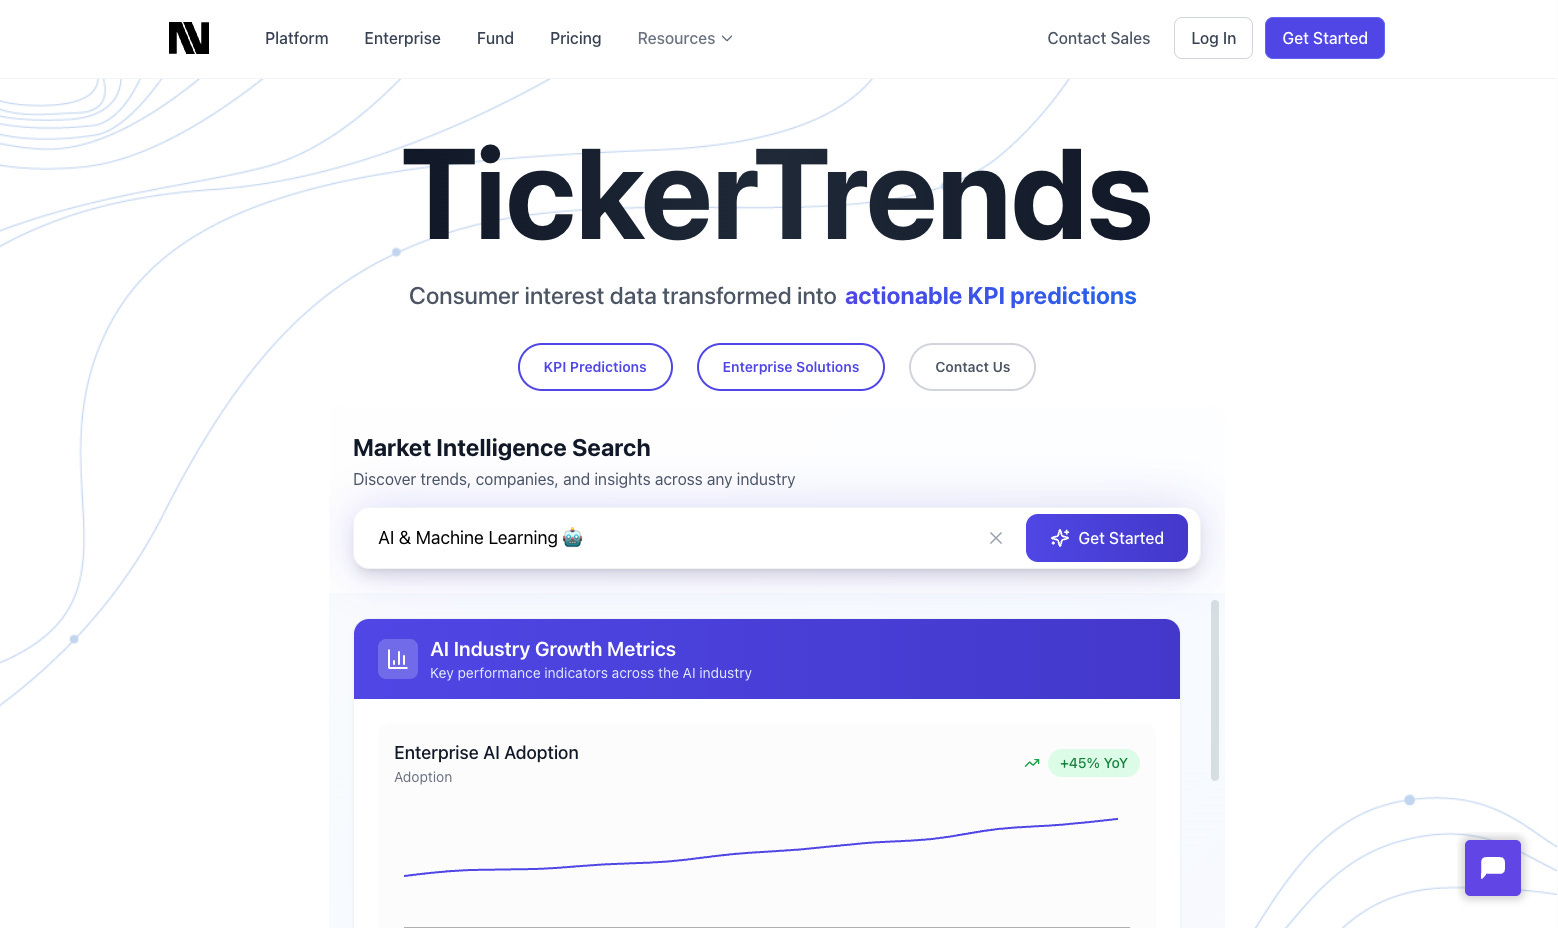
Among these KPI prediction platforms, TickerTrends stands out for its ability to detect emerging consumer trends from search data and social media behavior – often earlier than any competitor blog.tickertrends.io. The philosophy behind TickerTrends is that in the digital age, consumer interest and cultural shifts will appear online before they appear in sales figures or investor guidance blog.tickertrends.io. In other words, before consumers open their wallets (data which shows up in credit card panels that YipitData or M Science might track), they often exhibit intent – researching products, discussing brands on social media, searching for new apps, etc. TickerTrends focuses on capturing these pre-purchase intent signals. Its platform continuously monitors what consumers are searching for on Google, what they’re buzzing about on TikTok, YouTube, Reddit, and more, and how they’re engaging with websites and apps in real time blog.tickertrends.io. By listening to this global online “buzz,” TickerTrends can uncover which new products, brands, or experiences are suddenly capturing people’s attention long before those trends translate into revenue spikes or stock analyst upgrades blog.tickertrends.io.
In essence, TickerTrends explicitly embraces a “social arbitrage” strategy – a term popularized by investor Chris Camillo – which means trading on information from everyday consumer behavior and social trends before Wall Street has caught on. TickerTrends makes this systematic by quantifying online behavior (search volumes, social mentions, web traffic changes) and linking these data points to relevant stock tickers. The value of this approach is the lead time it offers. TickerTrends users can spot a rising interest in a niche product or a viral brand weeks or months in advance of when such interest shows up in company sales or official KPIs blog.tickertrends.io. That lead time is critical for investors. For example, if TickerTrends data shows that a new snack food or a fashion item is going viral – say Google searches for that category are up hundreds of percent, or a hashtag is exploding on TikTok – an investor gets an early hint that companies tied to that product (manufacturers, retailers carrying it, etc.) could see a sales boost soon blog.tickertrends.io. A hedge fund could build a position in those stocks before the revenue surprise hits. By the time traditional indicators (like quarterly sales reports or even credit card data) confirm the trend, a TickerTrends-informed investor may have already realized gains as the stock climbed on the emerging news.
What differentiates TickerTrends from the more transaction-focused platforms is this forward-looking angle. As the company itself explains, many data providers rely on lagging indicators – a typical service might tell you what happened last week (e.g. how much consumers spent at a retailer or how many subscribers a streaming app added last month). In contrast, TickerTrends aims to hint at what’s going to happen next by showing you what’s catching fire among consumers right now blog.tickertrends.io. It detects the spark before the flame. This isn’t to say that transaction data isn’t valuable – in fact, purchase data is excellent for “nowcasting” a company’s current performance – but TickerTrends focuses on forecasting emerging opportunities that haven’t yet materialized on the balance sheet blog.tickertrends.io. By catching subtle shifts in consumer sentiment and interest early, TickerTrends enables investors to position proactively, exploiting the gap between what consumers are doing and what investors (and analysts) expect blog.tickertrends.io. Exploiting this information gap is essentially the definition of alpha in markets.
TickerTrends backs up this approach with concrete results. The platform’s internal social-arbitrage fund, for example, has demonstrated strong returns by systematically trading on early consumer trend signals blog.tickertrends.io. TickerTrends also offers practical tools like its “Exploding Trends” dashboard and custom alerts, which allow users to monitor when a surge in interest occurs for a specific keyword or topic blog.tickertrends.io. An investor can set an alert if, say, the 30-day moving average of search volume for a new diet supplement jumps by a certain threshold year-over-year – essentially flagging an inflection point in consumer interest. These features help ensure that shifting momentum in consumer behavior is caught as it happens, not weeks later. The end result is that TickerTrends users often gain a timing edge and unique insight. They might know first that a particular product is becoming a craze (because the social and search data are exploding) and can trade on that knowledge while others are still reacting to old data. By the time quarterly earnings or even the credit card panels catch up to validate the story, a TickerTrends-informed position can already be well in profit blog.tickertrends.io. In fast-moving consumer markets – where today’s viral TikTok gadget or viral app can turn into tomorrow’s revenue driver – TickerTrends gives investors a chance to trade on the leading edge of information, complementing the more reactive insights from platforms like YipitData and M Science.
Case Study: Duolingo (DUOL) – Early Signals and Shifting Momentum
One example that highlights TickerTrends’ approach in action is Duolingo (NASDAQ: DUOL), the popular language-learning app. Duolingo operates a freemium model (a free ad-supported app with an optional paid tier) and its key growth metrics include active user counts and paid subscriber additions. In early 2022, Duolingo experienced a massive acceleration in user growth – an inflection point that became evident in its monthly active user (MAU) and daily active user (DAU) numbers. TickerTrends data indicates that this surge was detectable even earlier through online interest signals. In fact, towards late 2021, TikTok hashtag mentions of Duolingo began rising sharply, foreshadowing the user growth that would take off in 2022 medium.com. At the same time, TickerTrends tracked upswings in web traffic and search trends for Duolingo, clearly showing an upward inflection in consumer interest before the official user numbers went parabolic medium.com. Investors paying attention to these alternative signals had a head start – they could see that Duolingo was becoming a viral phenomenon on social media and garnering unprecedented attention, weeks or months before those users actually translated into higher app usage metrics and revenue. By the time Duolingo’s quarterly reports confirmed the big jumps in active users, those early observers (leveraging TickerTrends’ alerts on exploding social buzz) would have already recognized the shifting momentum in consumer behavior toward language learning apps.
Other alternative data providers caught on as Duolingo’s growth became tangible, but generally closer to the event. For example, as the app’s active user counts and subscriber revenues climbed, transaction data sets likely started reflecting more Duolingo subscription purchases (e.g. credit card panels would show increased billings for Duolingo’s paid plans). An analyst using YipitData or Second Measure around that time could have observed the uptick in consumer spending on Duolingo’s app and anticipated strong revenue results. Similarly, M Science or app analytics services would have noted higher mobile app usage and longer session times, confirming that user engagement was spiking. The crucial difference is timing: these signals (transactions, app usage) tend to register when or after the growth is happening, whereas TickerTrends identified the early spark – the swelling online chatter and interest that preceded the growth. In the Duolingo case, TickerTrends essentially rang the bell before the others fully heard the music.
Duolingo daily active users (DAUs) by quarter, comparing TickerTrends’ forecast vs. Wall Street consensus vs. actual reported figures. TickerTrends often predicted Duolingo’s user metrics more accurately or earlier than consensus, flagging inflections in growth.
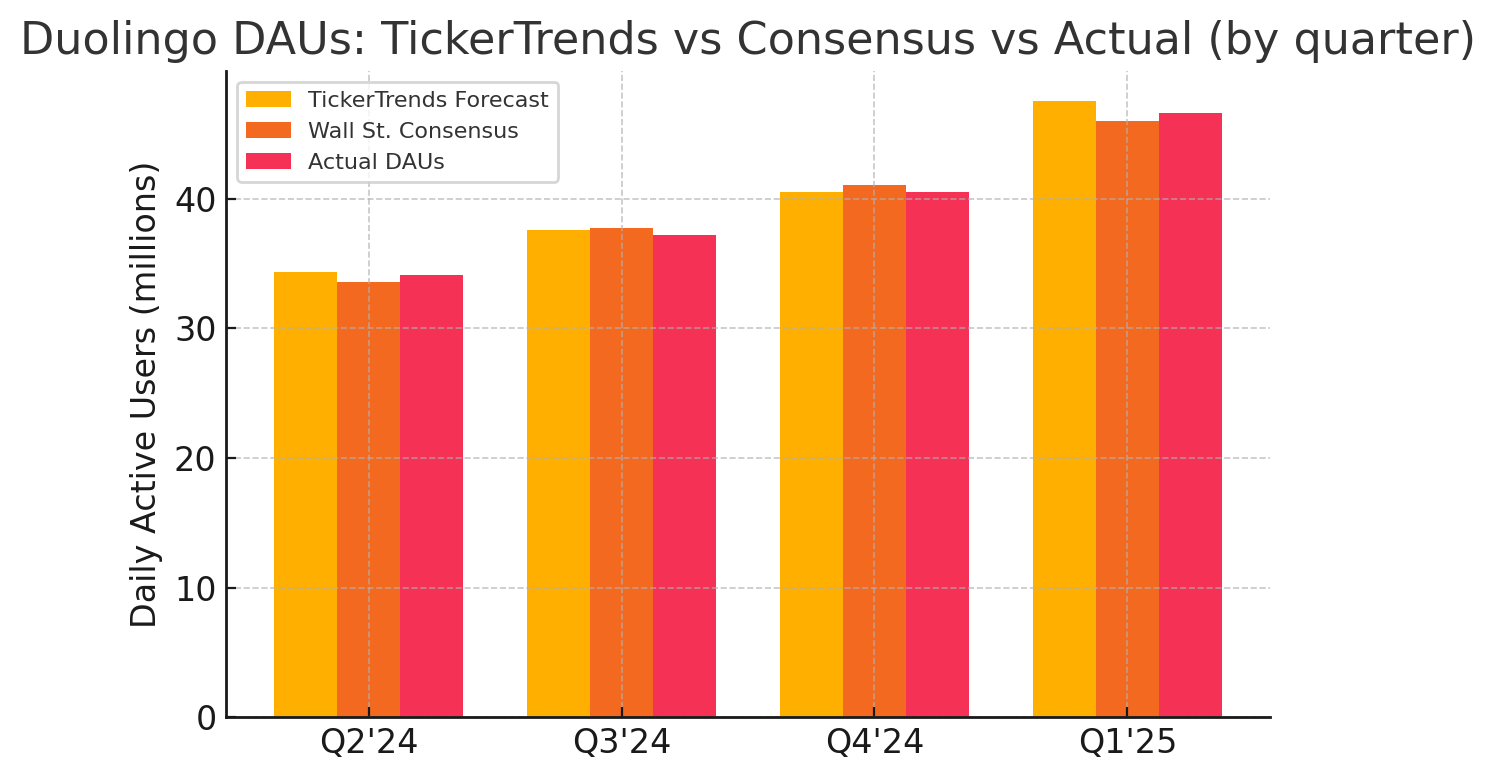
The chart above illustrates TickerTrends’ forecasting edge for Duolingo’s DAUs in recent quarters. For instance, in Q2 2024 TickerTrends projected about 34.36 million daily active users for Duolingo, notably above Wall Street’s consensus of 33.56 million; Duolingo ultimately reported 34.1 million DAUs for that quarter tickertrends.io. That beat in user metrics (and thus likely in revenue) sent the stock up over 10% in a day tickertrends.io, and TickerTrends had signaled the strength early by being ahead of the consensus. Fast forward to Q1 2025 – a quarter where Duolingo’s new AI-driven features were driving engagement – and again TickerTrends was ahead of the Street: it forecast ~47.5 million DAUs vs. the ~46.0 million consensus. Duolingo reported 46.6 million, surpassing expectations, and the stock surged over 20% on the results tickertrends.io. In this case, TickerTrends’ alternative data signals picked up on the exceptional growth momentum and pointed to a coming upside surprise. By contrast, if an investor had only been relying on traditional analysis or slower data, they might have missed the chance to anticipate that jump. It’s worth noting that TickerTrends was not infallible – in one quarter (Q4 2024) its data foresaw a slight weakness (forecasting DAUs below consensus) which aligned with Duolingo missing user expectations and the stock dropping tickertrends.io. But overall, the platform consistently identified the direction of surprises, whether positive or negative, by tracking the real-time pulse of consumer interest in Duolingo. This case study underscores how an early read on consumer behavior (from search queries to social media virality) can translate into actionable investment insight. TickerTrends effectively caught Duolingo’s inflection point as it was forming, while other alternative data providers and analysts confirmed the trend a bit later through spend and usage metrics.
Conclusion: Inflection-Spotting for a Competitive Edge
The rise of alternative data has fundamentally changed how investors track the consumer sector. Providers like YipitData and M Science have proven that scraping unconventional datasets can yield actionable signals about a company’s performance well ahead of official news. YipitData showed that by analyzing purchase receipts one can anticipate retail sales surges before they happen blog.tickertrends.io, and M Science demonstrated that blending data sources (from credit cards to social sentiment) can foretell stock rallies before the market catches on blog.tickertrends.io. In short, these platforms enable funds to make more informed decisions, spot risks early, and generate alpha by relying on data-driven foresight rather than just gut feel. Each platform, however, has its niche and strengths. Transaction-based services like YipitData (and peers such as Second Measure or Earnest) excel at high-frequency tracking of consumer spending, which is perfect for nowcasting revenue trends in retail, e-commerce, dining, and other consumer arenas blog.tickertrends.io. They shine in telling you what consumers did recently – a powerful indicator for near-term financial results. Multi-source research firms like M Science offer depth and corroboration, painting a richer picture by confirming trends across several datasets; they are invaluable when an investor wants to double- and triple-check a thesis using different lenses (spending, web traffic, social buzz, etc.).
TickerTrends fills a critical gap in this landscape by focusing on what consumers are going to do next. Its early detection of inflection points through search and social data gives investors a chance to act on shifts in consumer momentum before those shifts show up in credit card bills or quarterly earnings blog.tickertrends.io. In the fast-paced consumer sector – where trends can go viral and fizzle in a matter of weeks – this proactive, forward-looking insight is a significant strategic edge. Notably, TickerTrends doesn’t replace the need for transaction data or comprehensive research; rather, it complements them. An ideal approach for a savvy fund might be to use multiple tools in tandem – for example, catching a nascent trend via TickerTrends’ social signals, then validating it with M Science’s multi-source data and quantifying the sales impact with YipitData’s transaction figures. By synthesizing these approaches, investors can cover all the bases: the spark of consumer interest, the fire of actual sales, and the context provided by broader analysis.
Ultimately, the common goal of YipitData, M Science, and TickerTrends is to generate alpha through early detection. Each does so in a different way – YipitData by reading the consumer’s wallet, M Science by piecing together diverse clues, and TickerTrends by listening to the consumer’s mind and zeitgeist. The Duolingo example we examined showcases how these approaches play out in practice, with TickerTrends identifying the trend at its inception and others quantifying it as it unfolded. For investors in the consumer sector, the takeaway is clear: alternative data can illuminate the road ahead, and those who harness it can anticipate market-moving shifts in consumer behavior before the rest of the market catches on. By balancing transaction data with search and social insights, platforms like TickerTrends, alongside YipitData and M Science, empower investors to spot inflection points early and ride the wave of shifting consumer momentum to profitable ends.