
Deep Fusion Model for Stock Prediction Using News and Time Series Data | TickerTrends Research

The TickerTrends Social Arbitrage Hedge Fund is currently accepting capital. If you are interested in learning more send us an email admin@tickertrends.io .

Original PDF: https://link.springer.com/article/10.1007/s00521-024-10303-1
Author(s): Pinyu Chen, Zois Boukouvalas, Roberto Corizzo
Abstract
Traditional machine learning models often focus on a single data type or combine multiple sources with basic methods, which can limit their effectiveness. This proposed model integrates daily stock prices, technical indicators, and news sentiment using a BERT-based branch for processing financial news headlines and an LSTM branch to capture temporal patterns in stock prices and indicators. Experiments across 12 stock datasets show that this approach outperforms popular baseline models in both prediction accuracy and trading performance, highlighting the benefits of multimodal deep learning for stock forecasting.
Introduction
Stock market data is complex due to its multi-dimensional, volatile, and evolving nature, and it is influenced by external factors like macroeconomic events and media reports. While autoregressive models are good at handling temporal patterns, they struggle with multivariate data and nonlinear feature interactions. Machine learning and deep learning models, like LSTMs, can address these issues but typically only analyze a single data source, reducing their effectiveness in volatile markets. Ensemble and hybrid methods are promising alternatives, as they incorporate multiple data sources and predictors, leading to better performance. Recent research emphasizes integrating various data types, such as financial news and stock prices, to create more accurate predictive models.The paper proposes a multimodal deep learning model for predicting stock market trends, integrating multiple data sources such as stock prices, technical indicators, and financial news headlines. It addresses the shortcomings of existing models that analyze these data types in isolation or use simple combination strategies. By utilizing a FinBERT branch for sentiment analysis on financial news and an LSTM branch for capturing temporal patterns in stock prices, the model improves generalizability and prediction accuracy.
The contributions of the paper include:
A deep fusion model that combines different modalities for a better understanding of stock market dynamics.
An end-to-end optimization process for tuning the model to improve prediction performance.
Extensive evaluation across 12 stocks under various market conditions, showing the model’s superior accuracy and effectiveness in automated trading simulations compared to state-of-the-art methods.
Method and Construction

The paper outlines a multimodal deep learning model for stock market trend prediction, integrating historical stock prices, technical indicators, and financial news headlines using two main branches: LSTM (Long Short-Term Memory) for time-series data and FinBERT (a fine-tuned version of BERT specialized in financial text) for sentiment analysis. The model is designed to capture both quantitative data from stock prices and qualitative data from news sentiment, merging them through a fusion layer to make more robust stock trend predictions.
Detailed Workflow:
Data Gathering and Preprocessing:
Stock Price and Technical Indicators: Data is retrieved using the Yahooquery API, a replacement for the now-defunct Yahoo Finance API. This provides daily stock prices, including opening, closing, high/low prices, and volume. TA-lib, a technical analysis library, is used to compute key indicators like moving averages (12-day and 26-day), MACD, Bollinger Bands, and stochastic oscillators. The numerical data is normalized using min-max normalization to ensure that all values are on the same scale, enhancing the performance of the deep learning model.
News Headlines: Financial news headlines are fetched from the EODHD API. Only news from reliable sources like Yahoo Finance is retained. Each article’s sentiment score is computed using FinBERT, which provides positive, negative, and neutral sentiment scores. For each day, the headline with the highest sentiment score is selected for use in the model.
2. LSTM (Long Short-Term Memory) Networks:
LSTM networks are widely used in analyzing time-series data due to their ability to learn long-term dependencies. They solve issues like vanishing and exploding gradients common in traditional RNNs by using memory cells that preserve important information over time. Each LSTM memory cell consists of three gates — input, forget, and output — which regulate the flow of information, ensuring that relevant data is retained and irrelevant data is discarded.
In this model, the LSTM branch processes stock prices and technical indicators to identify temporal patterns and nonlinear relationships between different features and timestamps.
3. FinBERT (Sentiment Analysis for Financial News):
FinBERT is a specialized NLP model fine-tuned on financial text data, such as the TRC2-financial corpus from Reuters and the Financial PhraseBank, to improve sentiment analysis in the context of financial news. Unlike general-purpose BERT models, FinBERT captures the unique nuances of financial language, making it more accurate for stock market predictions.
The model uses self-attention mechanisms to compute sentiment scores from news headlines. After sentiment extraction, these scores are converted into a sentiment summary for each day, identifying whether the news is overall positive or negative. The most representative headline is selected based on sentiment scores, and an embedding vector for the headline is generated for integration with the LSTM branch.
4. Multimodal Fusion Layer:
The two modalities (stock prices/indicators and news sentiment) are fused together in the model using a concatenation layer. The time-series data processed through the LSTM and the sentiment embeddings from FinBERT are combined, allowing the model to learn from both data types.
By merging quantitative stock data with qualitative sentiment, the model can gain a comprehensive understanding of market dynamics, leading to more accurate stock trend predictions.
5. Training and Optimization:
The model uses a sliding window approach to predict the next day’s stock trends. It is trained on historical data up to the previous day, then predicts the trend for the next day, which ensures real-time adaptability to market fluctuations.
Hyperparameter tuning is applied to optimize both the LSTM and FinBERT branches. Techniques such as dropout and batch normalization are employed to prevent overfitting, and learning rate adjustments are made to fine-tune the model’s performance.
The model’s final prediction is a probability between 0 and 1, where values closer to 1 indicate a likely positive trend, and values closer to 0 suggest a negative trend.
6. Evaluation:
The model is evaluated on 12 real-world stocks from different sectors during two distinct market conditions: an uptrend (June to December 2021) and a downtrend (January to September 2022). This comprehensive evaluation includes both model accuracy and portfolio performance in a realistic trading simulation.
Results show that the multimodal fusion model outperforms traditional stock market prediction methods, highlighting the power of integrating multiple data modalities to capture market complexity.
Experiment and Model Performance:
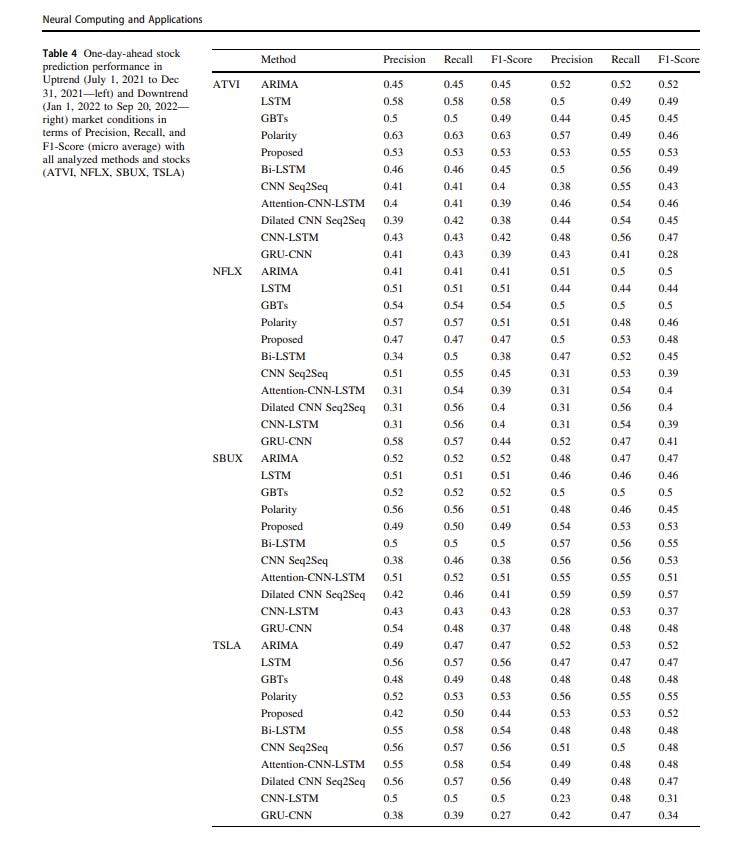

The table presents the performance metrics (Precision, Recall, and F1-Score) for one-day-ahead stock prediction across different machine learning methods, applied to various stocks (ATVI, NFLX, SBUX, TSLA, and more) under Uptrend and Downtrend market conditions.
Key Insights:
Stock-Specific Performance:
ATVI: The Polarity method and Proposed method generally perform well, especially under Uptrend conditions with higher F1-Scores compared to other methods. The Bi-LSTM method shows some strength, but its performance varies.
NFLX: GBTs (Gradient Boosting Trees) and Polarity methods show consistent performance across both market conditions. The Proposed method also does well, especially in the Uptrend scenario.
SBUX: Similar to NFLX, the Polarity method performs consistently well. The CNN-LSTM and GRU-CNN methods show relatively strong performance in the Uptrend scenario.
TSLA: The Dilated CNN Seq2Seq method shows strong performance in the Downtrend scenario, particularly in terms of Recall and F1-Score. Attention-CNN-LSTM also performs well.
2. Method-Specific Performance:
Polarity: Across all stocks, the Polarity method consistently achieves strong F1-Scores, indicating its effectiveness in predicting stock movements.
Proposed Method: Generally shows good performance, particularly for ATVI in Uptrend conditions.
GRU-CNN: This method tends to underperform compared to others, particularly in the Downtrend conditions, where it shows low F1-Scores.
Dilated CNN Seq2Seq: Particularly strong in predicting TSLA in Downtrend scenarios, showing the highest F1-Scores for that stock.
3. Market Condition Impact:
Uptrend vs. Downtrend: Some methods, like the Proposed method, Polarity, and CNN-LSTM, tend to maintain relatively stable performance across different market conditions, though the performance metrics generally decline slightly in Downtrend conditions.
Specific Sensitivities: Certain methods, such as GRU-CNN, appear more sensitive to market conditions, showing a noticeable drop in performance during Downtrends.
4. Comparison Across Market Conditions:
Downtrend vs. Uptrend:The performance of methods varies significantly between market conditions. For example, GBT’s perform well in both conditions but slightly better in Uptrend.
Polarity seems to struggle more in Downtrend, as indicated by both its lower F1-Score and statistically significant p-values.
Attention CNN-LSTM and Dilated CNN Seq2Seq appear to have more challenges in Downtrend markets, while methods like GBT’s and LSTM seem more robust across different market conditions.
Overall, the table highlights that no single method is best for all stocks or market conditions. However, methods like Polarity, Proposed, and certain deep learning models (e.g., Dilated CNN Seq2Seq) show promising results, especially under specific conditions and for specific stocks. The variation in performance across methods and stocks indicates the importance of choosing the right model based on the specific context of the prediction task.
As an example, the authors simulate portfolio changes with buy and sell signals on specific stocks. In this case we see the performance of AAPL.

The table highlights the effectiveness of different prediction methods under varying market conditions. In uptrend conditions, several advanced methods (e.g., Dilated CNN Seq2Seq, Bi-LSTM) significantly outperform simpler models like ARIMA. In downtrend conditions, while gains are generally lower, some methods (e.g., Proposed, Dilated CNN Seq2Seq) still manage to produce positive results. This analysis suggests that the choice of prediction method can greatly impact portfolio performance, especially under different market scenarios.

Additionally, the authors show various examples of the buy and sell signals the proposed model produces such as the one above.
Portfolio Experiment:
Using these signals, the authors re-did the experiment to change the share quantities traded based on whether the stock was in an uptrend or downtrend.
In this portfolio analysis experiment, a budget of $10,000 USD was allocated to purchase as many shares as possible based on the prevailing market price each day. The “Max Shares” parameter, set at 1, 5, or 10, dictated the number of stocks to be bought or sold daily, guided by trend predictions from various models. When a downtrend was predicted, shares were sold to mitigate potential losses, increasing the USD balance, which could be reinvested in an uptrend. If no balance was available during an uptrend, the existing shares were held. At the end of the simulation, all shares were sold to calculate the final portfolio value, measuring gains or losses relative to the initial investment.
The simulations spanned two distinct periods: an uptrend (July 1, 2021, to Dec 31, 2021) and a downtrend (Jan 1, 2022, to Sep 20, 2022). The results, detailed in multiple tables and figures, indicate that multimodal models generally outperformed individual base models. Notably, models that may not have ranked highest in accuracy, like the proposed multimodal model, still achieved the highest portfolio gains, especially during downtrends, where they demonstrated superior capital preservation compared to the buy-and-hold strategy.
The analysis also showed that binary performance metrics like F1-Scores may not fully capture the profitability potential, as they treat all days equally, regardless of price volatility. In contrast, models that effectively predict on high-volatility days can yield higher gains. The proposed multimodal model, which integrates diverse data sources and captures complex, nonlinear relationships, provided more robust and accurate predictions.
The “Max Shares” parameter’s impact varied across stocks and market conditions. During uptrends, a lower “Max Shares” value of 1 often yielded better performance, whereas during downtrends, the optimal value varied significantly by stock. This suggests that “Max Shares” is stock-specific and requires tailored strategies, emphasizing the need for individualized analysis to maximize portfolio performance.
Conclusion:
This article introduces a novel multimodal deep learning method for financial time series forecasting, specifically addressing the challenge of next-day trend prediction by combining text and time series data. The model integrates a BERT-based branch fine-tuned on financial news and an LSTM branch to capture temporal patterns. Extensive experiments on real-world stock market data demonstrated that the proposed method is competitive with popular baselines in both uptrend and downtrend conditions.
The portfolio analysis highlighted the method’s effectiveness in trading scenarios, yielding positive gains in uptrends and preserving capital in downtrends, outperforming other baselines and a buy-and-hold strategy. However, the study’s limitations include reliance on a single source for news headlines and the lack of consideration for correlations between stocks in predicting individual stock trends. Future research will explore the use of additional data modalities and advanced deep learning methods, such as attention mechanisms and graph convolution, for further improving next-day trend prediction in the stock market.
Discord Link: https://discord.gg/dGEW4Pyacd
Hedge Fund Enquiries: admin@tickertrends.io
Follow Us On Twitter: https://twitter.com/tickerplus