
$IBKR Interactive Brokers Earnings Preview | TickerTrends.io
$IBKR KPI Metrics, Earnings Preview Tracking, Expectations And Alternative Data Comps


Market Expectations

Analysts expect 16.82% YOY growth which is a contraction of -1.31% QoQ going into Q1 2025.
Interactive Brokers (IBKR) reported strong key performance indicators (KPIs) for March 2025, indicating robust client engagement and trading activity ahead of its Q1 2025 earnings release.
March 2025 KPI Highlights:
Daily Average Revenue Trades (DARTs): 3.47 million, up 43.9% year-over-year; however, this represents a 4% decline from February 2025.Nasdaq
Cleared Average DARTs per Customer Account: 211, marking a 6% increase year-over-year but a 6.2% decrease from the previous month.Nasdaq
Customer Accounts: Total accounts reached 3.62 million, a 31.7% increase year-over-year and a 2.1% rise from February.Nasdaq
Net New Accounts: 74,400 added in March, up 26.7% year-over-year but down 20% from February.Nasdaq
Options Contracts: 133.7 million contracts traded, up 35.7% year-over-year and 11% from the prior month.Nasdaq
Futures Contracts: 23.4 million contracts traded, a 36.1% increase year-over-year and a 22.5% rise from February.Nasdaq
Client Equity: $573.5 billion, up 23.1% year-over-year but down 2.4% from the previous month.Nasdaq
Client Credit Balances: $125.2 billion, a 19.4% increase year-over-year and a 1.1% rise from February.Nasdaq+1Nasdaq+1
Margin Loan Balances: $63.7 billion, up 34.4% year-over-year and slightly higher than the previous month.Nasdaq
These figures suggest continued growth in IBKR's client base and trading volumes, despite minor month-over-month declines in some areas. The year-over-year increases across multiple metrics reflect strong performance leading into the Q1 2025 earnings announcement.
Alternative Data
Web Traffic


Recent data indicates a +0.26% MoM acceleration in web traffic.
Mobile App Usage

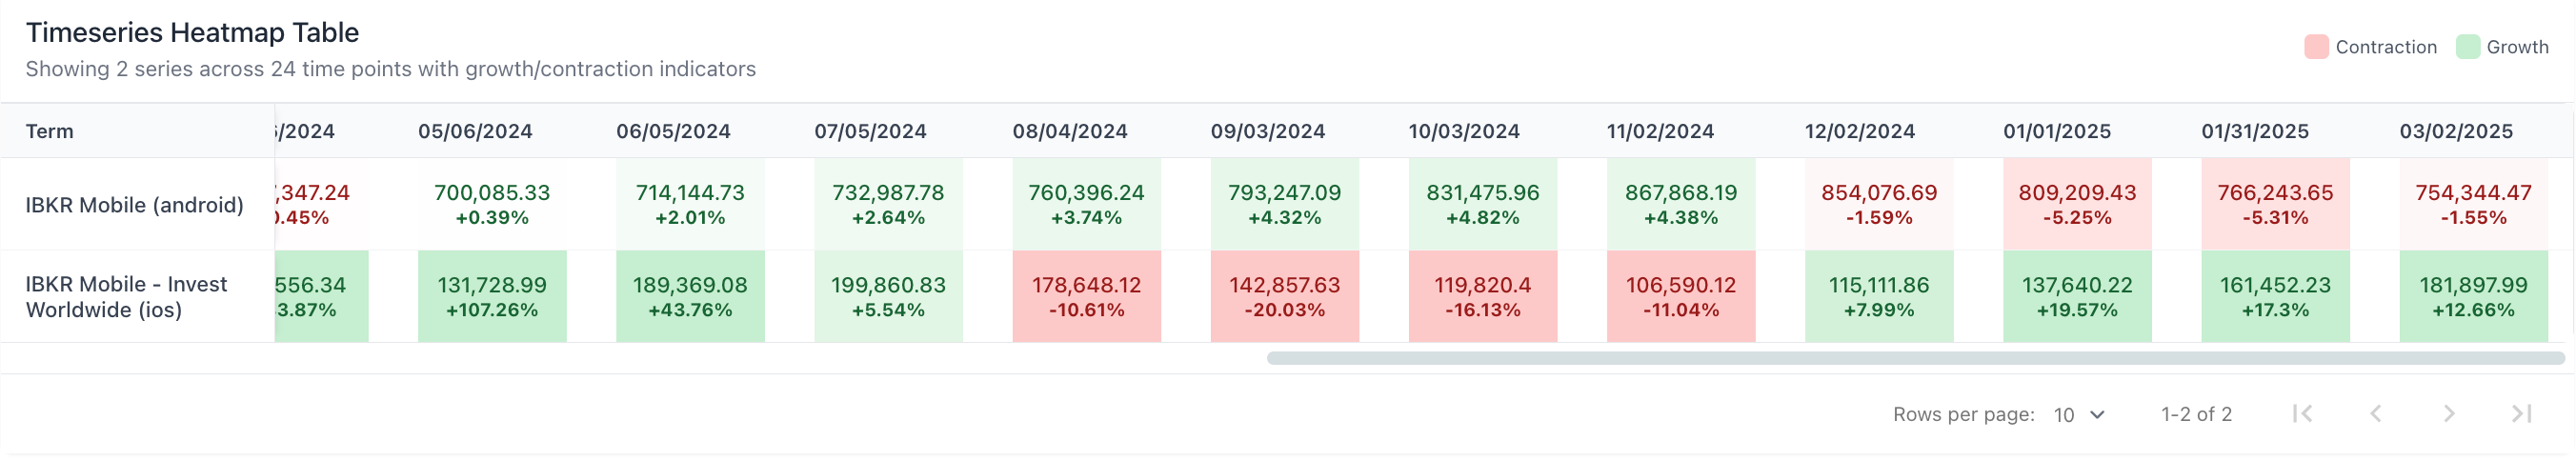
Recent data indicates a -1.55% MoM slowdown in android usage.
Recent data indicates a +12.66% MoM acceleration in ios usage.
Wiki Pageviews


Recent data indicates a -4.25% MoM slowdown in Wiki pageviews.
Reddit Subs


Recent data indicates a -7.68% MoM slowdown in reddit subs.
Social Followers


Recent data indicates a 4.87% MoM acceleration in social followers.
Conclusion
Despite a projected 16.82% year-over-year revenue growth for Q1 2025, Interactive Brokers (IBKR) faces a modest 1.31% sequential decline, reflecting a potential normalization following a robust Q4 2024. March's key performance indicators (KPIs) reveal strong annual growth—DARTs up 43.9% and client accounts increasing by 31.7%—yet slight month-over-month declines suggest a tempering of momentum. Alternative data presents a mixed picture: a 12.66% rise in iOS app usage contrasts with a 1.55% drop in Android usage and a 4.25% decrease in Wikipedia pageviews. As IBKR prepares to announce its earnings on April 15, investors should consider both the company's solid long-term growth trajectory and the recent indicators of short-term deceleration.
Track real-time alternative data on TickerTrends.io