
Introducing Market Share Graph: Track Competitive Shifts in Real Time
A new way to measure how consumer and developer demand shifts across products in real time

The Market Share graph is built differently. It tracks real-time demand signals using alternative data sources like web traffic and Amazon search volume, allowing us to measure how share is shifting as it happens.
Instead of waiting for reported numbers, we can observe a more immediate question:
Where are people actually going, and what are they actively searching for?
From Activity to Market Share
Every interaction online leaves a footprint.
Visiting a product page
Searching for a tool
Comparing alternatives
Looking up use cases
Individually, these actions are small. But when aggregated at scale, they form a high-frequency view of demand distribution across competitors.
The Market Share graph converts this activity into a time series, where each product’s share reflects its portion of total demand within a category. As behavior shifts, the graph updates, revealing who is gaining and who is losing ground.
What emerges is not a static snapshot, but a living view of competition.
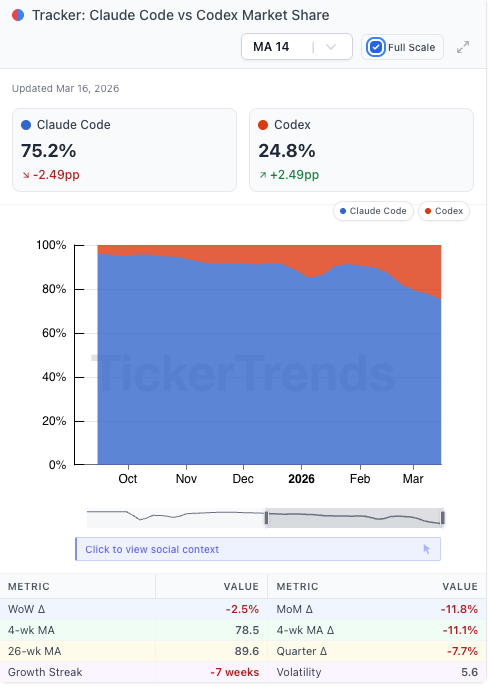
A Real Example: Claude Code vs Codex
When applied to AI coding tools, the signal becomes clear.
Claude Code currently holds a dominant share of tracked demand, but that dominance has started to erode. Over recent weeks, its share has trended downward, while Codex has steadily gained ground.
This doesn’t necessarily reflect a sudden product change, it reflects behavioral shifts.
More users are:
Searching for alternatives
Exploring different tools
Redistributing attention across the category
The Market Share graph captures this transition as it unfolds, not after it’s already priced in.
Why This Matters
Traditional market share is backward-looking.
It tells you what happened last quarter.
But demand doesn’t move in quarters, it moves continuously.
By tracking inputs like web traffic and search volume, the Market Share graph surfaces:
Early signs of competitive pressure
Gradual shifts in user preference
Inflection points before they become obvious
In fast-moving markets, these shifts are often subtle at first. A few percentage points gained or lost over time can signal a much larger change underway.
What the Data Is Actually Capturing
At its core, this graph is measuring intent.
Web traffic reflects where users are choosing to spend time.
Search volume reflects what users are actively looking for.
Together, they create a more complete picture of demand:
Passive interest (browsing, visiting)
Active intent (searching, comparing)
When both begin to shift in the same direction, it’s rarely random.
A More Dynamic View of Competition
The key advantage of the Market Share graph is that it doesn’t treat competition as static.
Instead, it shows how:
Leaders can slowly lose ground without headlines
Challengers can gain share before broad recognition
Entire categories can rebalance over time
In the example above, Claude Code is still the clear leader, but the trajectory matters more than the level.
Direction is often more important than dominance.
The Bottom Line
Markets follow behavior.
Behavior shows up in data long before it shows up in financials.
The Market Share graph provides a direct way to track that behavior, continuously, and at scale, using real signals from how people search and navigate online.
For access to our KPI forecasting platform, please contact admin@tickertrends.io .
TickerTrends Enterprise provides access to tracking and forecasting across 500+ public company KPIs, alongside actionable, data-driven research.
https://tickertrends.io/enterprise