
Introducing the TickerTrends Consumer Interest Tracker: Real-Time Brand Momentum, Quantified
Track Real-Time Brand Momentum with Weekly Signals Across Search, Social, Traffic, and More

In public markets, knowing how a public ticker’s brand, product, or service portfolio is performing in real-time is paramount. That’s exactly why we built the TickerTrends Consumer Interest Tracker. By combining the vast amounts of digital alternative data we track in real-time, we show users one singular value meant to capture “Consumer Interest”. Our new tracker distills raw alternative data into a simple weekly KPI that shows how consumer interest is changing, both year-over-year and in real terms. It blends the most actionable digital signals available today — Search trends, Website Traffic, Mobile App usage, E commerce search volume, Reddit growth, TikTok growth, Instagram / social media growth and much more — into a unified metric investors can use to understand brand momentum across time.
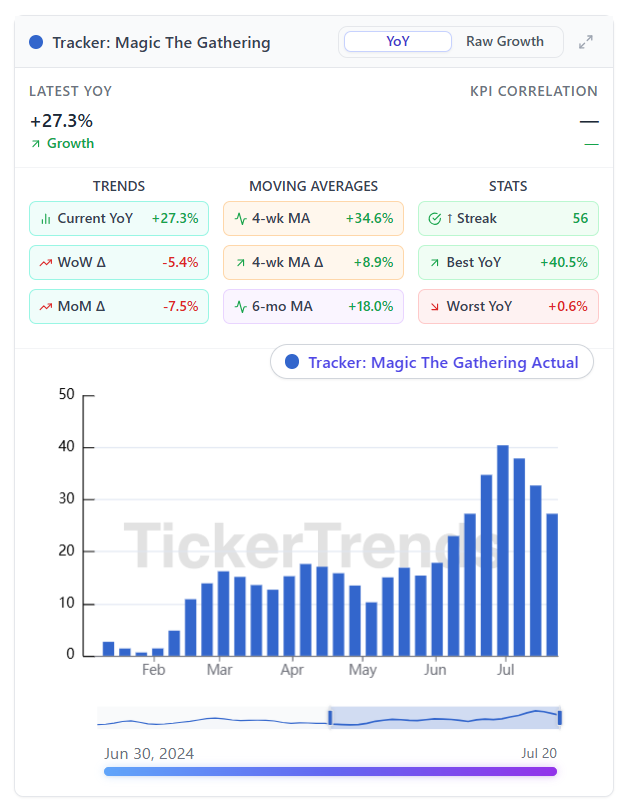
Year-over-Year view:
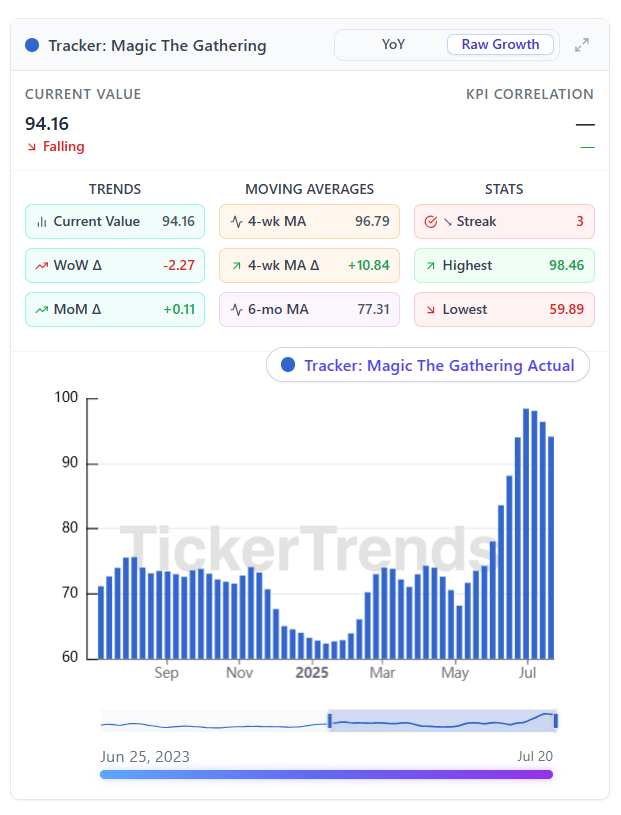
Raw Growth View:
Why does that matter?
Because in a world where guidance is often vague and analyst models are slow to adjust, brand momentum is one of the clearest leading indicators for revenue growth especially for consumer-facing companies. We’ve seen it time and time again: when digital attention ramps up, revenue often follows.
Take Magic: The Gathering as a recent example. Our tracker spotted a strong acceleration in May with our YoY rising steadily throughout May into June from ~+10% YoY to ~+40% YoY, alongside a 56-week streak of steady positive momentum. That kind of signal can be especially helpful for tracking Hasbro’s WOTC revenue segment between earnings calls. This signal led to actionable results as seen by the massive YoY and QoQ growth the WOTC segment saw in Q2 2025, with revenue hitting 522M +13% QoQ growth and 15% YoY growth, which crushed the 470M analyst estimate for the WOTC segment. Because the tracker updates every single week, investors don’t have to wait for a quarterly press release to get a read on how the brand is trending. The direction and magnitude of change in the trackers can provide actionable trading insights.
Key features:
Weekly YoY trend: Tracks how total consumer digital interest compares to the same week last year. Abnormal spikes or falls might present actionable trading opportunities.
Raw growth view: For names with exponential growth, oftentimes the raw values (normalized from 0 to 100) do a better job in displaying the strength of the trend. It also lets users understand whether tough or easy comps are coming up soon, giving context around the shown YoY values. The raw growth view essentially helps give context around the low base effect that can happen in new products oftentimes.
Streaks, Best/Worst YoY, Moving Averages: Automatic context around the trend so you know how extreme (or sustained) the signal has been.
Correlation scores: Where possible, we show how closely the trend aligns with KPI’s reported by the company itself such as reported GMV, Total Revenue, DAU metrics, etc. This essentially tells investors “How much did this tracker correlate to real numbers the company put out?”
Conclusion
These trackers help investors view and track brand momentum on a weekly basis. They update based on real-time consumer data and interest in a brand, service or product a public company sells. They give you conviction about where things might be going before reported earnings, before upgrades, and before most market participants notice.
You can now find the Consumer Interest Tracker live on most KPI Pages within the TickerTrends platform.
Please email admin@tickertrends.io to gain access to our entire KPI dashboard which includes coverage of over 200 unique KPIs available on TickerTrends Enterprise: https://tickertrends.io/enterprise