
Navigating the Storm: Leveraging Alternative Data with Tickertrends in a Macro-Focused World
The TickerTrends Social Arbitrage Hedge Fund is currently accepting capital. If you are interested in learning more send us an email admin@tickertrends.io.


Introduction
Global financial markets and economies operate within an increasingly complex and interconnected system. The sheer pace of global economic shifts, amplified by geopolitical tensions, rapid technological change, and unforeseen crises like the COVID-19 pandemic, often outstrips the reporting cadence of traditional economic indicators. Metrics such as GDP, inflation rates, and unemployment figures, while fundamental, are typically released with significant lags monthly or quarterly and are frequently subject to revision. This inherent delay renders them less effective for navigating volatile market conditions or identifying critical economic inflection points in real-time, a limitation starkly highlighted during the rapid economic contractions and subsequent recoveries observed during the pandemic. Consequently, relying solely on these lagging indicators can leave investors and policymakers perpetually looking in the rearview mirror.
In response to these challenges, a paradigm shift is underway, driven by the proliferation of digital technology and the vast amounts of data it generates. "Alternative data" has emerged as a critical complement, sometimes even a leading source of insight, for financial market participants. Defined broadly as information gleaned from non-traditional sources outside of standard company disclosures and government releases, alternative data offers unique, often real-time perspectives on economic activity, corporate performance, and consumer behavior. Its market is experiencing explosive growth, with forecasts predicting compound annual growth rates exceeding 50% and market sizes potentially reaching hundreds of billions of dollars within the next decade. Sophisticated investors, particularly hedge funds, were early adopters, recognizing its potential to generate alpha – market-beating returns derived from unique informational advantages.
Within the diverse universe of alternative data, two categories stand out for their particular relevance to macroeconomic analysis: sentiment tracking and keyword trend analysis. These data types offer a powerful lens into the collective psychology and focus of economic actors – consumers, investors, and businesses. Sentiment analysis quantifies the mood, opinions, and emotions expressed in text from sources like news articles and social media, while keyword trend analysis monitors the volume and patterns of online searches and mentions related to specific topics. Understanding this human element – public attention, fear, optimism, and shifting concerns – is crucial because these factors are potent drivers of economic decisions and market reactions, often preceding changes captured by traditional metrics.
Alternative vs. Traditional Data
In the context of financial markets and investment management, alternative data refers to information gathered from non-traditional sources, utilized to gain insights beyond those available through standard company disclosures or conventional economic statistics. It encompasses data generated outside the direct reporting channels of a company, often originating as a byproduct of a firm's operations, individual activities, or sensor measurements. This data provides unique and often timely perspectives that can inform investment decisions, risk management, and macroeconomic forecasting.
The distinction between alternative and traditional data lies primarily in their origin, structure, accessibility, and timeliness. Traditional financial data typically includes sources like company financial statements (balance sheets, income statements), regulatory filings (e.g., SEC filings), official earnings reports, management guidance, investor presentations, broker research notes, and established macroeconomic indicators (e.g., GDP, CPI, unemployment rates) released by government agencies. In contrast, alternative data often exhibits unstructured (e.g., text, images) or semi-structured data, requiring significant processing and cleaning. Alternative data is often sourced from unconventional channels, sometimes proprietary or requiring specialized collection methods like web scraping and could be costly and accessibility could be limited due to its specialised nature. We consider alternative data to be superior as it is often available in near real-time or at much higher frequencies (daily, weekly) than traditional data.
This fundamental difference highlights a shift in analytical focus. Traditional data largely reflects reported outcomes – summaries of past performance or economic conditions. Alternative data, conversely, allows for the analysis of the underlying activities, behaviors, and sentiments that drive these outcomes. For instance, instead of waiting for quarterly retail sales figures, analysts can examine real-time credit card transactions , website traffic, or foot traffic data to gauge consumer activity as it happens. This capability transforms analysis from historical review towards predictive insight generation.
The universe of alternative data is vast and constantly expanding. For macroeconomic analysis, several categories are particularly pertinent:
Data from Individuals: This category captures the digital footprint of consumer and investor behavior and sentiment.
Social Media Sentiment: Analyzing platforms like Twitter/X, Reddit, StockTwits, and Facebook for public mood, opinions on economic issues, or company perception.
Search Trends: Monitoring search engine query volumes (e.g., via Google Trends) for keywords related to economic conditions ("inflation," "recession"), consumer goods, or financial markets.
Consumer Transaction Data: Aggregated and anonymized data from credit/debit card transactions or email receipts, providing real-time insights into spending patterns.
Mobile App Usage & Web Traffic: Tracking usage patterns of financial or retail apps, and monitoring website visits to gauge consumer interest or company digital engagement.
Product Reviews: Analyzing online reviews for sentiment regarding products or services, which can correlate with sales or brand health.
Geolocation/Mobility Data: Using smartphone GPS data (anonymized and aggregated) to track foot traffic to retail locations, workplaces, or points of interest, indicating consumer activity levels.
Data from Business Processes: This involves data generated through corporate activities.
Supply Chain Data: Information on shipping, logistics, and inventory levels, potentially indicating production activity or disruptions.
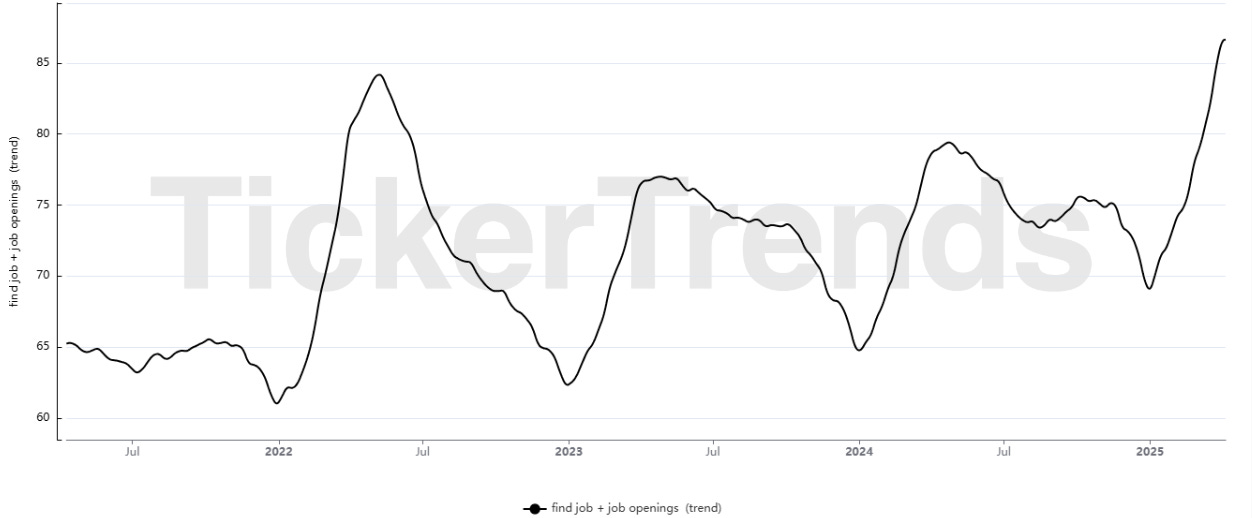
Job Postings: Tracking the volume and nature of online job listings as an indicator of corporate hiring intentions, growth, or contraction.
Corporate Filings (Text Analysis): Applying NLP to analyze the text of earnings call transcripts, annual reports (beyond just the numbers) for sentiment, key themes, or risk factors.
Industry KPIs: Specific performance indicators relevant to particular sectors (e.g., airline passenger numbers, hotel occupancy rates) sourced from industry associations or specialized providers (COMING SOON TO TICKERTRENDS).
Flight Tracking: Monitoring corporate jet movements for potential M&A activity or executive meetings.
Data from Sensors: This category includes data collected from physical sensors.
Satellite Imagery: Analyzing satellite photos to monitor economic activity (e.g., cars in parking lots, construction progress), track commodity supply (e.g., crop health, oil storage levels), or assess environmental impacts.
Internet of Things (IoT) Sensor Data: Data from connected devices potentially reflecting usage patterns or industrial activity.
Weather Data: Used particularly in commodity analysis or for predicting consumer behavior related to weather patterns.
The rapid rise and adoption of alternative data in finance is driven by data explosion and technological advancements. The digitization of commerce, communication, and daily life continues to generate an unprecedented volume of potentially valuable data that can be used to gain ‘alpha’ in the financial markets. This has been aided largely by Innovations in data collection (e.g., web scraping , sensor technology), storage (cloud computing), and analysis (Artificial Intelligence (AI), Machine Learning (ML), Natural Language Processing (NLP) ) make it feasible to process and extract insights from these vast and often unstructured datasets.
The importance of alternative data lies in its ability to provide a more comprehensive, timely, and granular view of economic and market dynamics. It helps investors monitor the health of companies, industries, or entire economies with greater immediacy, identify shifts before they are reflected in official statistics, and ultimately make more informed decisions. The sheer diversity and often unstructured nature of this data necessitate sophisticated analytical capabilities which TickerTrends strives to solve for.
Why Sentiment and Keywords Shine in Turbulent Times
While traditional macroeconomic indicators remain essential benchmarks, their utility diminishes significantly during periods of heightened market volatility, economic stress, or rapid structural change. Official statistics like GDP, inflation (CPI/PCE), and unemployment figures are inherently backward-looking. They are typically released monthly or quarterly, reflecting economic conditions weeks or even months prior. Furthermore, these initial releases are often subject to substantial revisions as more complete data becomes available. In fast-moving markets or during sudden crises, this delay means that by the time the data is published, the underlying economic reality may have already shifted significantly, making the information less actionable for timely decision-making or identifying crucial turning points.
Additionally, aggregate national statistics often mask important variations and underlying dynamics. They may not capture divergent trends across different regions, industries, or consumer segments. For example, national employment figures might obscure significant job losses in one sector offset by gains in another, or broad inflation numbers might hide sharp price increases in essential goods affecting lower-income households disproportionately. This lack of granularity hinders a nuanced understanding of the forces driving the macro picture.
Alternative data is typically useful during periods of significant disruption, such as the COVID-19 pandemic or major policy interventions, which can introduce considerable noise and distortion into traditional data series. Base effects (comparisons to highly unusual prior periods), the impact of government stimulus measures, and challenges in data collection (e.g., survey responses during lockdowns) can make interpreting standard indicators difficult and reduce their immediate reliability. Historical relationships and correlations may break down, rendering models based on past data less effective.
Timeliness and Granularity of Sentiment & Keyword Data
In contrast to the limitations of traditional indicators, alternative data derived from sentiment analysis and keyword trends offer distinct advantages, particularly in volatile and uncertain environments.
Sentiment analysis applied to social media feeds, news streams, or forum discussions, along with the monitoring of keyword search volumes (e.g., via Google Trends), provides a near real-time window into public mood, investor psychology, emerging concerns, and information-seeking behavior. This immediacy is invaluable when market conditions or economic outlooks are changing rapidly, allowing for quicker assessment and response.
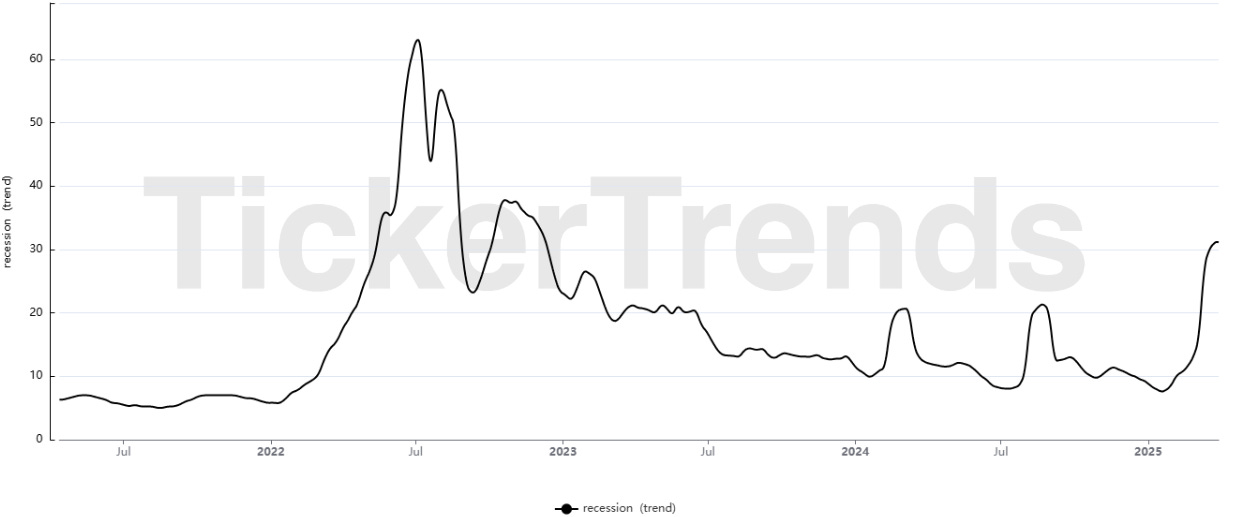
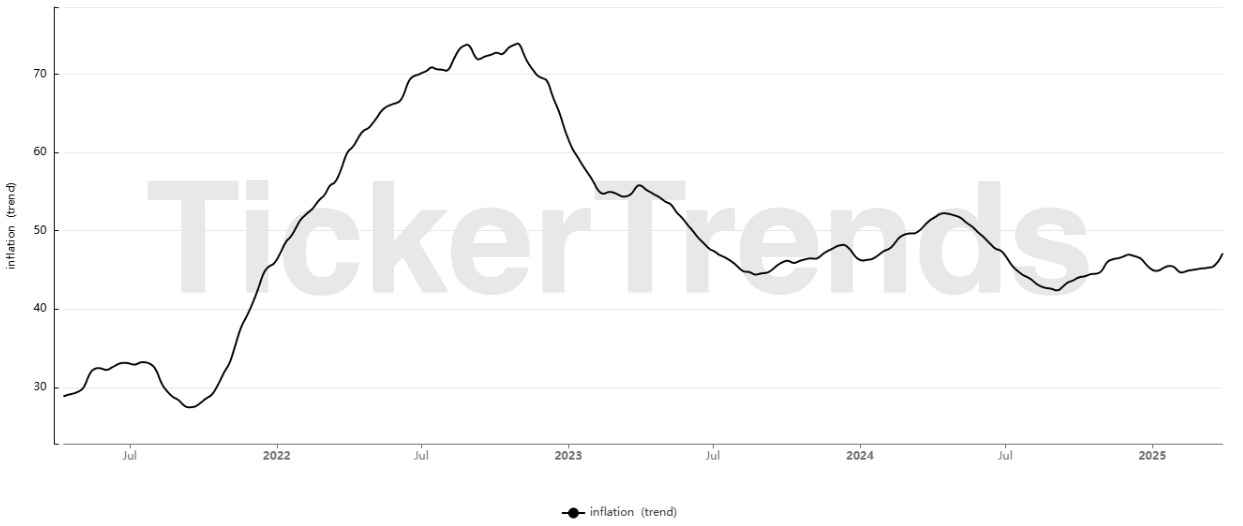
These alternative data types enable analysis at a much finer level of detail. It becomes possible to track sentiment specifically towards a new government policy, monitor the frequency of searches for keywords like "recession," "layoffs," or "inflation," or gauge consumer interest in specific product categories or brands. This granularity can uncover nascent trends, specific areas of stress, or shifts in focus that are completely invisible in aggregated national statistics. As we can see the recession trends and search trends related to layoffs have started to surge whereas the keyword “inflation” is not a primary concern anymore.

Crucially, changes in public sentiment and online search behavior often precede shifts in economic activity, consumer spending, or market movements. A surge in searches for "unemployment benefits" might signal upcoming increases in jobless claims, while rising negative sentiment in news articles about the economy could foreshadow a dip in consumer confidence or investment. This potential to act as a leading indicator provides a significant edge over lagging traditional data. Recognizing this value, even central banks and official statistical agencies are increasingly incorporating high-frequency and alternative data sources into their monitoring and analysis toolkits.

The unemployment trends are still relatively flat but should be monitored closely as tariffs start to take effect.
In essence, during periods of heightened uncertainty or rapid change, the perception and anticipation of economic events, vividly captured by real-time sentiment and keyword data, can become powerful drivers of immediate market reactions and economic decisions. John Maynard Keynes' concept of "animal spirits" – the emotional and psychological factors influencing economic behavior – finds a modern, measurable proxy in these alternative data streams. While traditional data eventually provides a measured assessment of what has happened, sentiment and keyword trends offer insights into what people think or fear might happen now, capturing the dynamic forces shaping the immediate future.
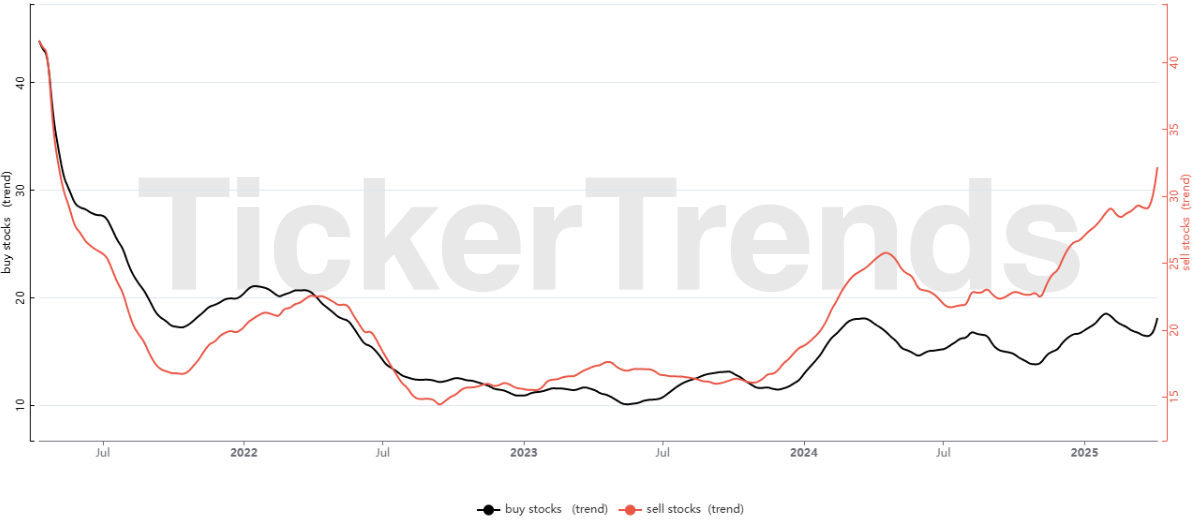
As we can see from the chart below, the search trends for “sell stocks” have been surging while “buy stocks” search trends remain flat exhibiting the fear in the capital markets.
The value of these alternative signals is particularly amplified during major structural shifts or crises, such as pandemics or energy shocks. Such events often disrupt established economic relationships and render historical patterns embedded in traditional data less reliable for forecasting future outcomes. In these situations, high-frequency alternative data – like mobility tracking during lockdowns, real-time transaction data showing shifts to e-commerce , or surges in searches for specific health or economic terms – provides a direct read on how the economy and society are adapting in the present. These contemporary signals offer far more relevant guidance than potentially obsolete historical correlations, explaining their growing importance in navigating unprecedented times.
Keyword Trend Analysis: Following the Narrative
Keyword trend analysis involves monitoring and analyzing the frequency, volume, and context of specific words, phrases, or search queries across various online platforms over time. The underlying principle is that changes in the collective attention and information-seeking behavior of the public, as reflected in their online searches and discussions, can provide valuable signals about emerging trends, shifting concerns, economic intentions, and potential future actions.
The primary data source for this type of analysis is often search engine data, particularly Google Trends, which provides indexed data on the relative popularity of search queries globally or within specific regions and timeframes. However, the scope extends beyond search engines to include:
Social Media Mentions: Tracking the frequency of specific keywords, hashtags, or topics on platforms like TikTok, Twitter/X, and Reddit.
News Mentions: Monitoring the occurrence of specific keywords within news articles to gauge media focus on particular economic themes.
Forum Discussions: Analyzing keyword frequency in relevant online forums.
Website Traffic: Examining website visit data driven by specific keyword searches.
E-commerce/Amazon Search Volumes: Tracking searches for products on platforms like Amazon.
Methodology: The core methodology involves:
Keyword Selection: Identifying relevant keywords or topics related to the specific economic phenomenon being analyzed (e.g., "inflation," "unemployment claims," "recession," "supply chain," specific product names, company tickers).
Frequency Tracking: Measuring the volume or frequency of these keywords over time.
Pattern Analysis: Analyzing the resulting time series data for significant changes, such as spikes, upward or downward trends, seasonal patterns (YoY or trend stacking analysis), and geographic variations.
Contextual Analysis: While frequency is key, understanding the context in which keywords are used (e.g., through accompanying sentiment analysis or topic modeling) can add significant depth and help disambiguate the meaning of a trend.
Output: The primary output is time series data illustrating the relative interest, attention, or discussion volume surrounding specific keywords or topics, often visualized as trend lines.
Applications: Identifying Shifting Focus and Anticipating Market Impacts
Keyword trend analysis offers valuable insights for macro analysis:
Tracking Public Attention & Concerns: Monitoring the rise and fall of public interest in key macroeconomic topics provides a real-time gauge of societal focus and anxiety. Spikes in searches for terms like "inflation", "recession , or "job losses"/"unemployment" often signal growing awareness or fear related to these issues, potentially impacting consumer confidence and behavior.


Nowcasting/Forecasting Economic Indicators: Search query data has proven useful in predicting or providing timely estimates (nowcasting) of official economic indicators before their release. Examples include using searches for unemployment-related terms to predict jobless claims, real estate terms to forecast housing market activity, or country names combined with economic terms to estimate GDP or capital flows, particularly for data-scarce developing economies.
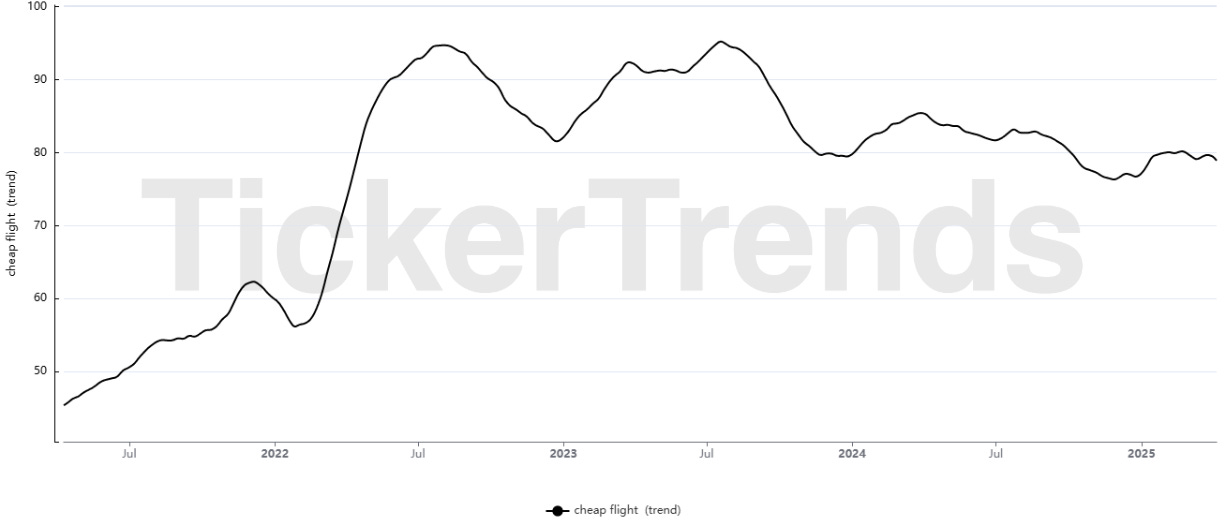
Consumer Behavior & Demand: Tracking search trends for specific products, services, brands, or related terms (e.g., "cheap flights," "discount code," "private label brands") offers insights into consumer interest, purchase intent, and evolving preferences. This can help anticipate demand shifts influenced by economic conditions or changing tastes.


Market Sentiment Proxy: Search activity for financial terms, such as "stock market crash," "buy stocks," specific ticker symbols, or investment strategies, can serve as a proxy for investor attention, interest, or even sentiment. Indices like the FEARS index, built from searches for negative economic terms, attempt to capture investor pessimism.
Identifying Emerging Trends: Detecting keywords or topics experiencing rapid growth in search volume or online discussion can signal the emergence of new technologies, consumer trends, investment themes, or potential market disruptions.


Keyword trend analysis essentially provides a direct, aggregated measure of public attention and information-seeking behavior related to economic and financial topics. When individuals or groups actively search for information about "recession" or "inflation," it reflects a level of awareness, concern, or intent that often precedes measurable changes in spending, investment, or official economic statistics. The documented correlations between search volumes and subsequent economic outcomes lend strong support to the idea that this collective online behavior can act as a valuable leading indicator. .
Harnessing Insights with Tickertrends
Navigating the complex and fragmented landscape of alternative data presents significant challenges, requiring specialized tools for aggregation, processing, analysis, and visualization. Enter Tickertrends, our platform specifically designed to address these needs within the financial markets and macroeconomic analysis domain. By positioning itself as a comprehensive service aiming to be the "Bloomberg Terminal" of alternative data, Tickertrends provides users with an integrated environment to access and leverage diverse data streams for actionable insights.
A core element of the platform's design is its "universal search engine" concept. This allows users to query across multiple alternative data types—ranging from social media chatter and web traffic to search trends and app usage—through an intuitive interface, simplifying the process of gathering relevant information for macro analysis or specific company research. Our platform aggregates and processes millions of data points, applying advanced algorithms and machine learning to uncover hidden trends and market opportunities.
Specific Features for Sentiment and Keyword Analysis
Tickertrends offers a suite of features specifically tailored for harnessing sentiment and keyword data for macro insights:
Broad Data Coverage: The platform integrates numerous data sources pertinent to sentiment and keyword analysis, including:
Search Trends: Google Search, YouTube Search, and Amazon search volume estimates.
Social Media Activity: TikTok mentions and Reddit posts, Subreddit growth and social media account growth metrics.
Web Traffic: Daily data (updated bi-weekly) potentially reflecting targeted interest.
Mobile App Usage: Daily app data and ranking data which can correlate with brand or service popularity.
Custom Data: Users can add custom terms, and institutional clients can request integration of new data sources, offering flexibility.
Keyword Analysis Capabilities: Users can track search volumes and mentions across multiple key platforms (Google, Amazon, YouTube, TikTok). The platform provides significant historical data depth, crucial for backtesting and trend analysis. A key feature is the automated mapping of keywords, social media terms, and websites to relevant financial tickers and companies, facilitated by machine learning algorithms, which significantly streamlines the research process.
Sentiment Analysis Integration: Tickertrends allows users to monitor sentiment derived from social media, news, and potentially consumer reviews (implied by brand performance tracking), providing a direct gauge of public and investor mood.
Proprietary Trend Indices : Beyond raw data access, Tickertrends offers synthesized, value-added metrics designed for financial analysis:
Social Arb Trend: A weighted index based on relevant company keywords, aiming to reflect the strength of a company's revenue potential or topline sales trends derived from digital alternative data sources.
Investor Expectation Trend: This index models the aggregate sentiment of retail market participants across various social media platforms. A high value (near 100) suggests an exuberant or highly engaged investor base, while a low value (near 0) indicates fear, apathy, or lack of attention.
Visualization and Analysis Tools: The platform includes tools like the 'Pro Chart' for visualizing multiple data series , a 'Data Screener' enabling users to monitor year-over-year trends for keywords linked to their watchlist stocks , and 'Ticker Ranking' tables with customizable formulas for sorting and prioritizing tickers or terms based on user-defined criteria combining different data points.
By integrating these diverse data sources and analytical tools, Tickertrends aims to streamline the workflow for macro analysts and investors. The platform facilitates the monitoring of real-time proxies for economic indicators (e.g., using web traffic for state unemployment sites as an early signal), tracking shifts in consumer behavior and preferences, assessing market and public reactions to policy changes or news events, and identifying emerging macroeconomic themes or potential risks.
We also launched "Exploding Trends". This curated page displays rapidly rising keywords, hashtags, and websites related to publicly traded companies, leveraging crowd-sourced input from the user base alongside internal curation. This functionality is designed specifically for discovering nascent trends and identifying potential investment opportunities or macro shifts before they become widely recognized, offering a distinct advantage in trend discovery.
The platform effectively seeks to bridge the gap between the often overwhelming volume of raw alternative data and the need for actionable, synthesized insights. By providing pre-processed data, specialized financial metrics like the proprietary trends, and tools linking keywords to tickers, Tickertrends reduces the analytical burden on the end-user, making sophisticated alternative data analysis more accessible. This combination of broad monitoring capabilities and dedicated trend discovery features positions the platform as a potentially powerful tool for both tracking established macro narratives and uncovering the new themes that will shape future market movements.
Case Studies
To illustrate the practical utility and potential predictive power of sentiment and keyword trend analysis in macro contexts, this section examines several case studies. These examples, drawing on recent historical events and plausible applications of current alternative data capabilities, demonstrate how these non-traditional data streams can provide timely and granular insights that complement or even lead traditional macroeconomic indicators.
Early Signals of Inflationary Pressures (2021-2022)
Following the initial shock of the COVID-19 pandemic, 2021 saw a global economic reopening fueled by pent-up demand, significant fiscal stimulus, and accommodative monetary policy. However, this recovery was accompanied by widespread supply chain disruptions. By late 2021 and accelerating dramatically in 2022 (exacerbated by the energy shock following Russia's invasion of Ukraine), inflation surged to multi-decade highs across many advanced economies. Initially, debates raged among policymakers and economists about whether the price pressures were "transitory" or more persistent, and official inflation metrics, while rising, lagged behind the rapidly evolving situation.
Analysis of Google Trends data reveals significant increases in search interest for inflation-related terms starting well into 2021 and peaking in 2022. Searches for "inflation" itself, as well as specific components like "gas prices" and "food prices," saw dramatic global and regional spikes. This surge in public information-seeking behavior clearly indicated rising awareness and concern about the cost of living long before inflation reached its peak levels or became the dominant policy focus. Academic studies have explicitly linked such search trends to subsequent inflation prints and inflation expectations.


Monitoring these converging signals from keyword trends and sentiment analysis via platforms like Tickertrends could have provided financial market participants and potentially policymakers with earlier, real-time warnings about the broadening and intensification of inflationary pressures. These alternative data streams reflected public perception and concern with greater immediacy than the lagging official CPI releases or the evolving consensus among economic forecasters, demonstrating their value in capturing the leading edge of a major macro shift.
Shifting Consumer Mega-Trend – The GLP-1 Weight-Loss Drugs (2022–2023)
Sometimes the hidden trend is not about a single stock, but a structural change in consumer behavior that unfolds while the market’s attention is elsewhere. A recent example is the rise of GLP-1 weight-loss medications (such as Ozempic, Wegovy, and Mounjaro) and the ripple effects across industries. During 2022 and 2023, much of the investor focus was on macro issues – inflation, interest rate hikes, war in Europe – and on the tech bear market. But quietly, a healthcare revolution was brewing: millions of people began using GLP-1 drugs for weight loss, dramatically altering expectations for the healthcare and consumer sectors.

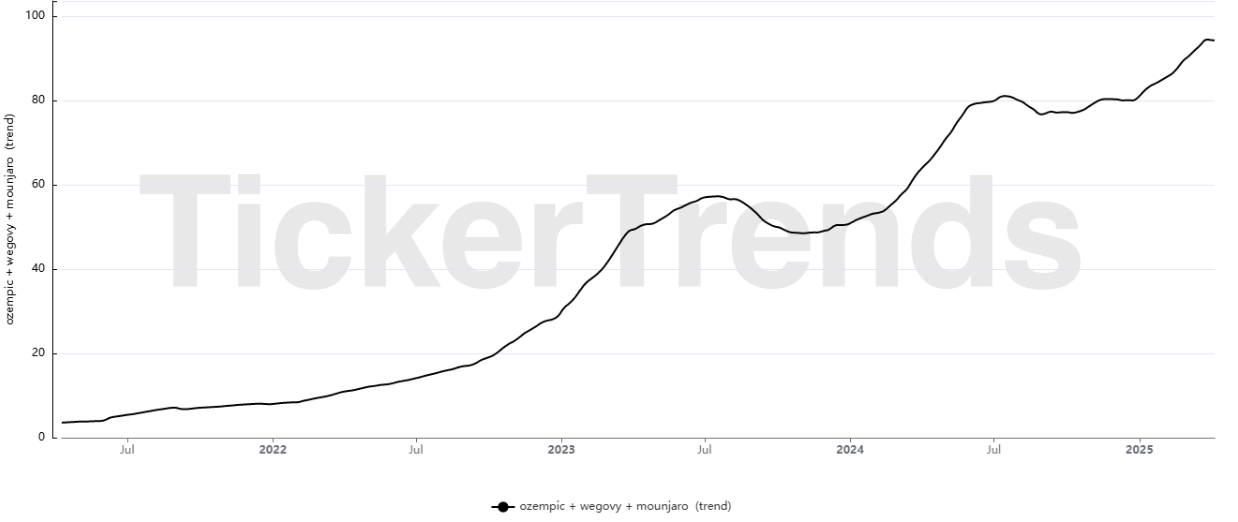
How could an investor have spotted this early? Keyword trends and social sentiment provided clear signals of surging interest. Online, curiosity about these drugs was skyrocketing: people were googling “Ozempic” and discussing its effects on social media and forums (including finance communities speculating on which companies would benefit or lose out). In fact, a 2024 study measuring global Google search popularity confirmed a significant and growing public interest in GLP-1 agonist drugs like Ozempic, Saxenda, Wegovy, and Mounjaro. The relative search volumes for these drug names hit all-time highs as news stories and word-of-mouth about their efficacy spread. Essentially, consumer sentiment toward weight-loss treatments flipped positive in a big way, signaling a potential paradigm shift in health and wellness.
TickerTrends’ Exploding Trends page is tailor-made for catching such shifts. It curates thousands of emerging terms with a multi-year view, helping surface new themes gaining traction. In this case, a TickerTrends user scanning exploding health-related terms might have noticed “GLP-1” trending. Upon digging in, they would see the upward trajectory of searches and social chatter around these drugs. An enterprising investor could then identify the stocks connected to this theme – for example, pharmaceutical companies like Novo Nordisk and Eli Lilly (makers of these drugs), or conversely, companies in weight management, diabetes devices, or even food and beverage sectors that might be impacted by widespread weight loss. Indeed, by late 2023, this trend had materially impacted markets: Novo Nordisk’s market cap soared so high (fueled by unprecedented demand for its drug) that it became the most valuable company in Europe, and companies in adjacent industries (from insulin pump manufacturers to junk-food producers) saw their stocks wobble on expectations that consumer habits would change.
The key takeaway is that shifts in public interest often presage shifts in market value. In a macro-volatile environment, few might have predicted that “obesity drugs” would be a defining investment theme of 2023. But those tracking the data – search trends, social discussions, even things like online prescription rates – could position themselves early in the winning trades (and avoid the losers). The GLP-1 case also shows how alternative data can reveal cross-sector opportunities. It’s not just about one stock – it’s about understanding a behavioral trend and then mapping out second-order effects (a skill known as “thematic investing”). TickerTrends, by allowing users to search any term and see related companies and keywords, facilitates this kind of thematic discovery. For instance, searching “Ozempic” on the platform might show related rising terms like “GLP-1”, “weight loss injection”, or “diabetes remission”, as well as companies linked to those terms. This gives a starting roadmap to research which equities might be influenced by the trend.

Conclusion
The landscape of macroeconomic analysis is undergoing a profound transformation, driven by the increasing velocity of market changes and the limitations of traditional data sources in capturing real-time dynamics. In this evolving environment, alternative data, particularly sentiment tracking and keyword trend analysis, has transitioned from a niche curiosity to an indispensable tool for sophisticated investors and analysts seeking a competitive edge.
This report has demonstrated that sentiment and keyword data offer unique advantages – primarily timeliness and granularity – that are especially potent during periods of volatility and economic uncertainty. By quantifying the collective mood, attention, and concerns expressed in news, social media, and online search behavior, these data streams provide a powerful lens into the psychological and behavioral factors that often lead, rather than lag, economic activity and market movements. They allow analysts to move beyond analyzing reported outcomes towards understanding the underlying drivers in real-time.
The exploration of data opportunities in shifting economic paradigms highlights the versatility of alternative data. Whether tracking corporate cost-cutting via job listings, monitoring consumer shifts towards value through transaction and search data, or gauging immediate reactions to policy changes, sentiment and keyword analysis provide critical intelligence when traditional growth metrics falter. Case studies spanning recent inflation surges, the COVID-19 crisis, and potential applications to past events like the GFC underscore the practical value and predictive potential of these techniques when applied rigorously.
However, harnessing this potential requires discipline. Best practices encompassing data validation, noise filtering, bias mitigation, robust compliance procedures (especially concerning MNPI and privacy), and thoughtful integration within a 'quantamental' framework are paramount. The complexities involved underscore the need for specialized expertise and tools.
Platforms like Tickertrends play a vital role in democratizing access to these powerful insights. By aggregating diverse, relevant data sources, providing sophisticated analytical capabilities, offering proprietary synthesized metrics tailored for financial analysis, and streamlining the user workflow, Tickertrends empowers users to effectively leverage sentiment and keyword data for macro decision-making. It helps bridge the gap between raw data and actionable intelligence, enabling users to both monitor established macro themes and discover emerging narratives.
As the alternative data market continues its exponential growth, fueled by advancements in AI and ML, the ability to effectively integrate and interpret signals from sentiment and keyword trends will become increasingly critical. For financial professionals navigating the complexities of the modern macro environment, mastering these tools and techniques is no longer just an option for gaining an edge; it is rapidly becoming essential for staying informed and competitive