
Ollie’s Bargain Outlet ($OLLI) Set to Beat Street Revenue Estimates
TickerTrends sees Ollie’s FQ2’25 revenue coming in above consensus—driven by accelerating website traffic, search interest, and app usage, with consistent upward KPI revisions.


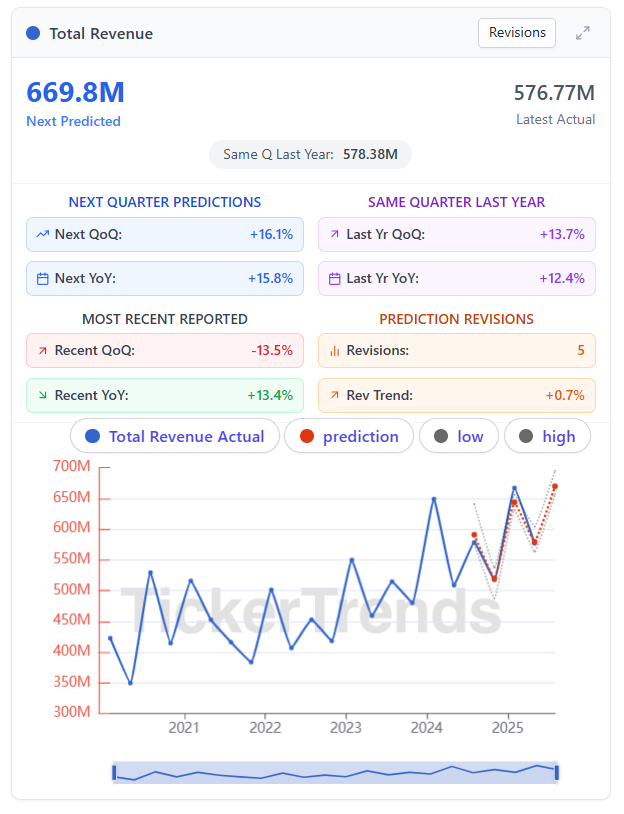
Ollie’s ($OLLI) looks set to beat current consensus expectations for FQ2’25. While Wall Street is forecasting $657.6 million in revenue, our TickerTrends KPI model is predicting $669.8 million, which would put the company about $12 million ahead of consensus, or roughly 2 percent higher. This would also marks a 2.4% YoY acceleration to Ollie’s top-line growth rate from their last earnings report, potentially exciting investors further leading to more upside in the stock.
This is supported by multiple trend indicators pointing in the same direction.
What’s Driving the Upside
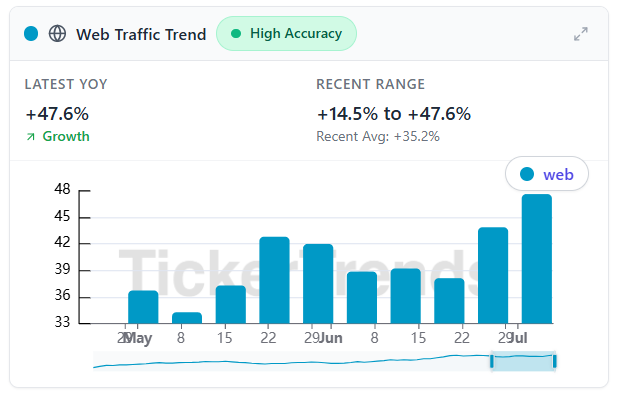
Website traffic to Ollie’s website and store locator pages has been rising with each recent week showing acceleration on a YoY basis, signaling stronger shopper interest in the brand. Over the last 2 months or so, we have seen a ~11% acceleration YoY since May in these collection of relevant websites.
Google Search interest in a collection of terms indicative of consumer brand interest have improved from March lows and show sustained interest YoY, suggesting steady demand. We currently see ~18.8% YoY growth in search terms related to Ollie’s in the lasted weekly print.

Mobile App Usage data has also continued to accelerated week after week across both Android and iOS.

Takeaway and commentary: Ollie’s is seeing momentum from multiple angles heading into FQ2. The company has aggressively expanded its store count by acquiring former Big Lots locations through bankruptcy auctions, which tend to attract their archetypal customer. We see signs in the alternative data channels we track of sustained momentum for the brand. With inflation still top of mind for shoppers, Ollie’s value-focused model is seeing accelerating traction. These tailwinds support our revenue prediction and expectation of a sizable revenue beat.


KPI Snapshot
Predicted Revenue: $669.8M
Street Consensus: $657.6M
Predicted Year-over-Year Growth: +15.8%
Last Reported Year-over-Year Growth: +13.4%
Same Quarter Last Year Year-over-Year Growth: +12.4%
Number of Upward Revisions This Quarter: 5
The model has revised higher five times this quarter. Late-quarter upward revisions are often a strong indicator that internal performance is tracking ahead of guidance or market expectations.
Bottom Line
Ollie’s is already trading near local highs, and some optimism may be priced in. But with consensus modeling only 13 percent growth, for now, Ollie’s strategy seems to be resonating with consumers and indicating sustainable growth. With data pointing toward a higher run-rate than consensus, the risk skew favors a revenue beat. If actuals come in near $670 million, with strong comps and signs of sustained demand, the stock could move meaningfully higher.

Please email admin@tickertrends.io to gain access to our entire KPI dashboard which includes coverage of over 100 unique KPIs available on TickerTrends Enterprise: https://tickertrends.io/enterprise