
TickerTrends Expands Data Coverage and Forecasting Capabilities
New developer activity metrics, media coverage data, and prediction signals enhance institutional insight into company performance and investor sentiment

We’ve released a major platform update for TickerTrends that expands the scope of data available to users and introduces new forecasting improvements. These updates are designed to give enterprise users more granular, reliable, and forward-looking insights into company performance and investor sentiment.
Below is a detailed overview of each new capability and how it can be used inside the platform.
Developer Activity Trends
This new data type tracks package and library download activity, providing a window into real-world product adoption and developer engagement. For technology and SaaS companies, developer behavior is often an early indicator of customer adoption and product momentum.

What it shows: Daily developer package download levels and directional trends
How it helps: Monitoring software development kits (SDKs), API libraries, and package usage can offer early insight into how widely a product or ecosystem is being adopted before that growth appears in financial metrics.
Where to find it: Add the NPM Downloads Volume data type under the Unstructured Data section for any ticker.
News Article Volume
This addition captures the volume of media coverage for any entered keyword or ticker. It helps users understand how attention and narrative cycles evolve across time.
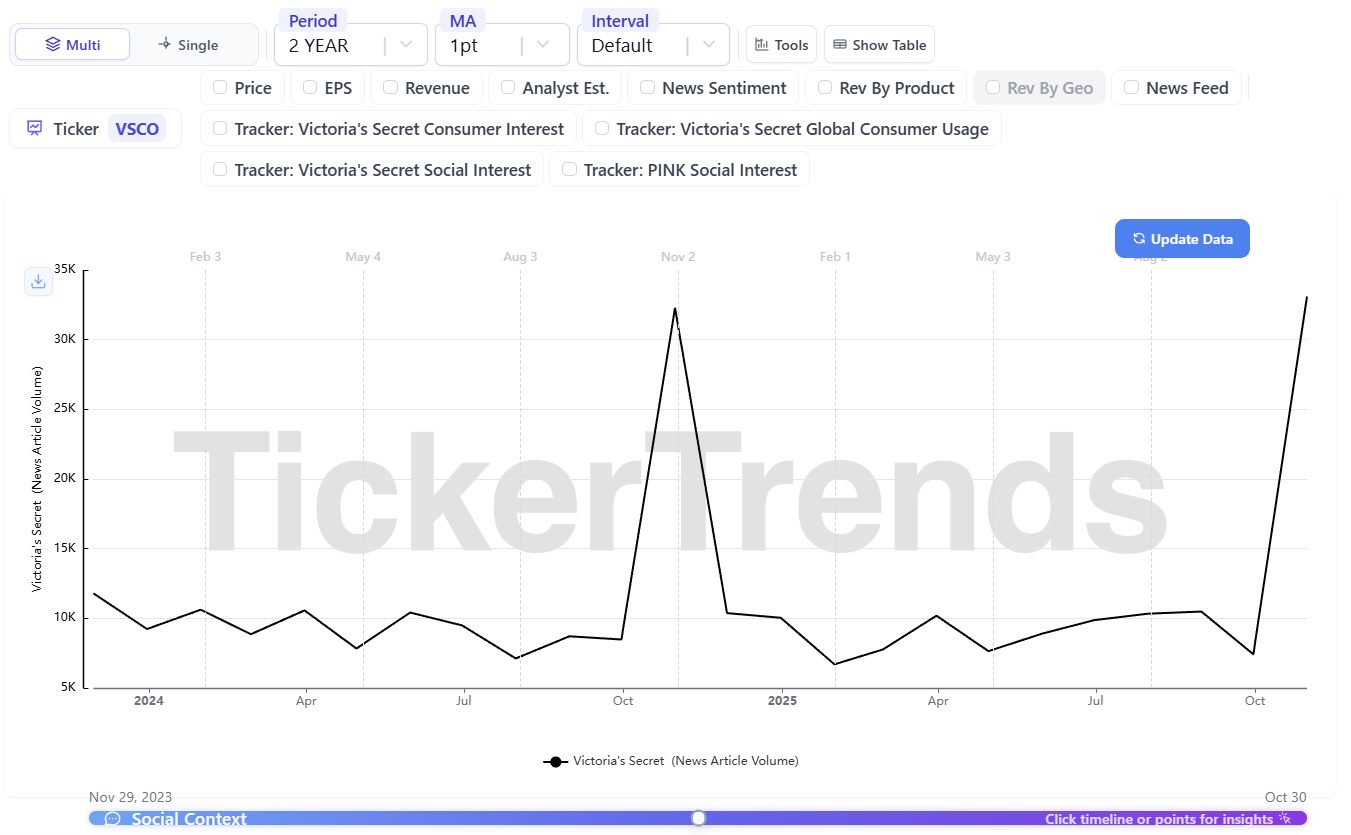
What it shows: Monthly article counts related to companies, brands, or themes
How it helps: Rising coverage often aligns with periods of higher volatility, more brand discovery or shifting sentiment. Tracking article counts can reveal whether a stock’s story is expanding or contracting in the public eye.
Where to find it: Add the News Article Volume data type in the Unstructured Data section of your dashboard.
Polymarket Earnings Odds
We have integrated data from Polymarket, a prediction platform that reflects real-time market expectations around corporate earnings outcomes.
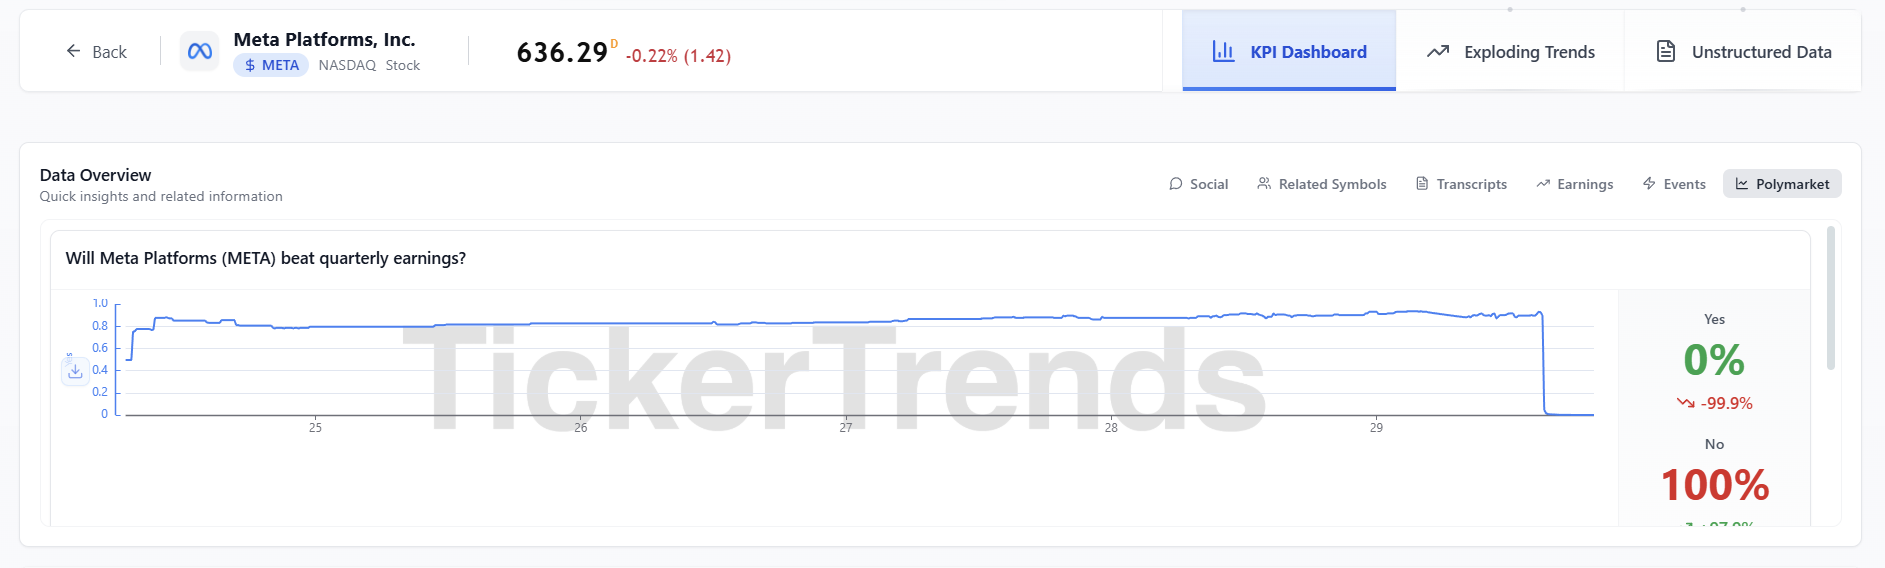
What it shows: Live probabilities for whether a company will beat or miss earnings estimates
How it helps: These odds provide an additional signal alongside traditional analyst forecasts, allowing users to compare investor sentiment with the implied probability of an earnings beat.
Where to find it: Toggle Polymarket data for supported tickers in your dashboard.
Google Trends AI Adjustment
In recent months, a large-scale anomaly affected certain Google Trends data, causing unexpected spikes across many keywords. We have implemented an AI-based correction to clean and normalize the dataset.
What changed: A one-time global adjustment was applied across impacted keywords to remove the anomaly.
Result: This fix restores continuity and comparability across historical data, making year-over-year and momentum analysis consistent again.
Why it matters: By restoring data integrity, you can once again rely on Google Trends signals as inputs for forecasting models and alternative data correlation studies.
New KPI Forecasts
Over the coming weeks, hundreds of new KPI forecasts will be rolled out across multiple sectors and tickers. These forecasts extend TickerTrends’ proprietary predictive framework, which combines alternative data, search interest, and engagement signals to model company performance with industry-leading accuracy.
What to expect: Expanded coverage across key performance indicators such as revenue, gross merchandise value, user growth, and engagement metrics.
Why it matters: These models continue to deliver among the lowest observed margins of error in the industry, improving confidence for institutional clients.
Tip: Check the KPI Screener tab regularly as coverage expands.
Coming Soon: Sell-Side Estimates and Bogeys
We are finalizing a new “Sell-Side Estimate” & “Buyside Bogey” View that merges published analyst estimates with our internal inference of what the market truly expects a company to achieve (e.g. the “whisper expectation” among buyside shops).
What it shows: Published estimates, inferred market bogey levels, and the gap between the two
How it helps: Sell-side estimates alone rarely capture the full range of investor expectations. This view clarifies where the true hurdle lies, helping users identify “ghost expectations” that drive post-earnings reactions.
Why it matters: Understanding these implicit expectations allows better calibration of forecast accuracy and risk-reward positioning before results are released.
Access and Support
All updates are now live for enterprise users. You can explore them in your existing dashboard or schedule a walkthrough with our team for a deeper explanation of how to incorporate these datasets into your workflow.
Resources:
For questions or feedback, contact admin@tickertrends.io.