

We’ve added a feature to TickerTrends called Research Tasks. It takes a research instruction written in plain English and returns a ranked, sourced report screened across our tracker universe: Consumer Usage, Developer Activity, app usage, and web and social signals.
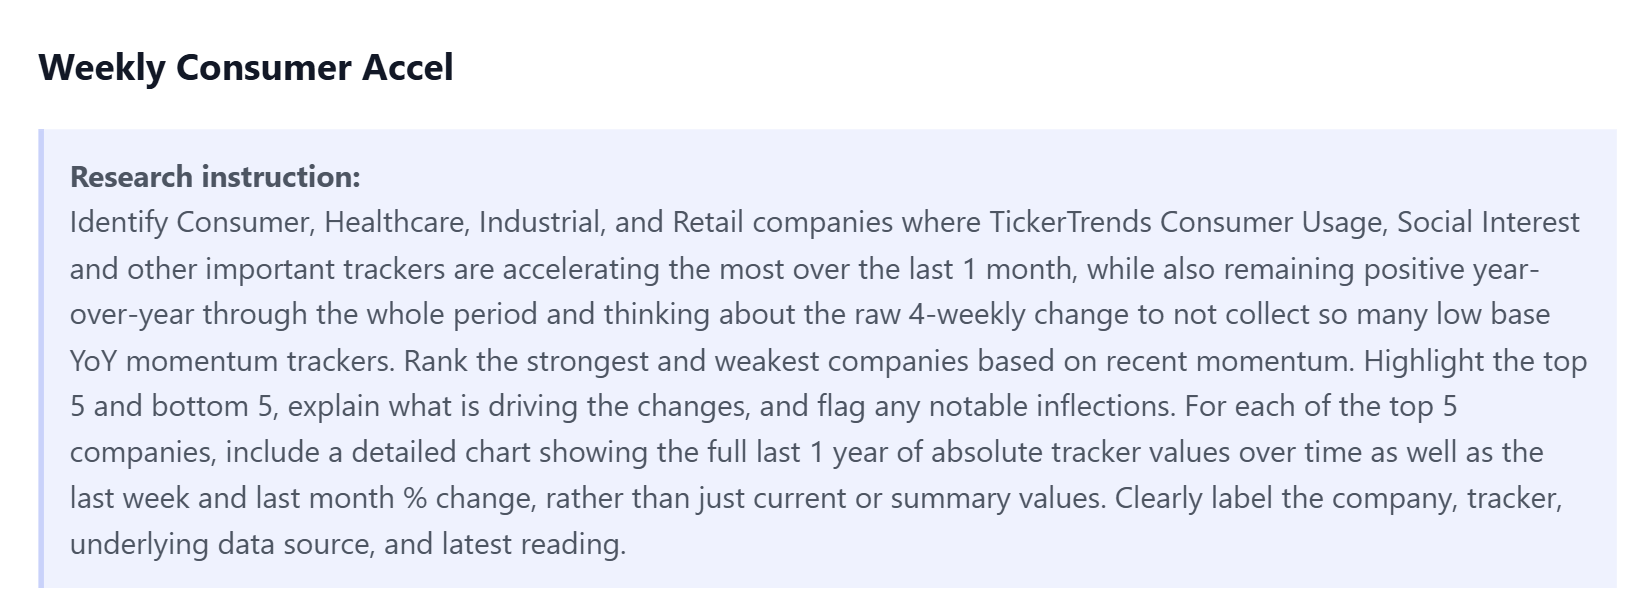
How it works
The user writes an instruction specifying what to screen for. TickerTrends runs that screen across the full public and private company universe and returns a report with an executive conclusion, a ranked table showing the metrics behind the ranking, social discussion insights, useful charts and more depending on what the user asks for in the prompt.
Tasks can run once or on a recurring schedule.
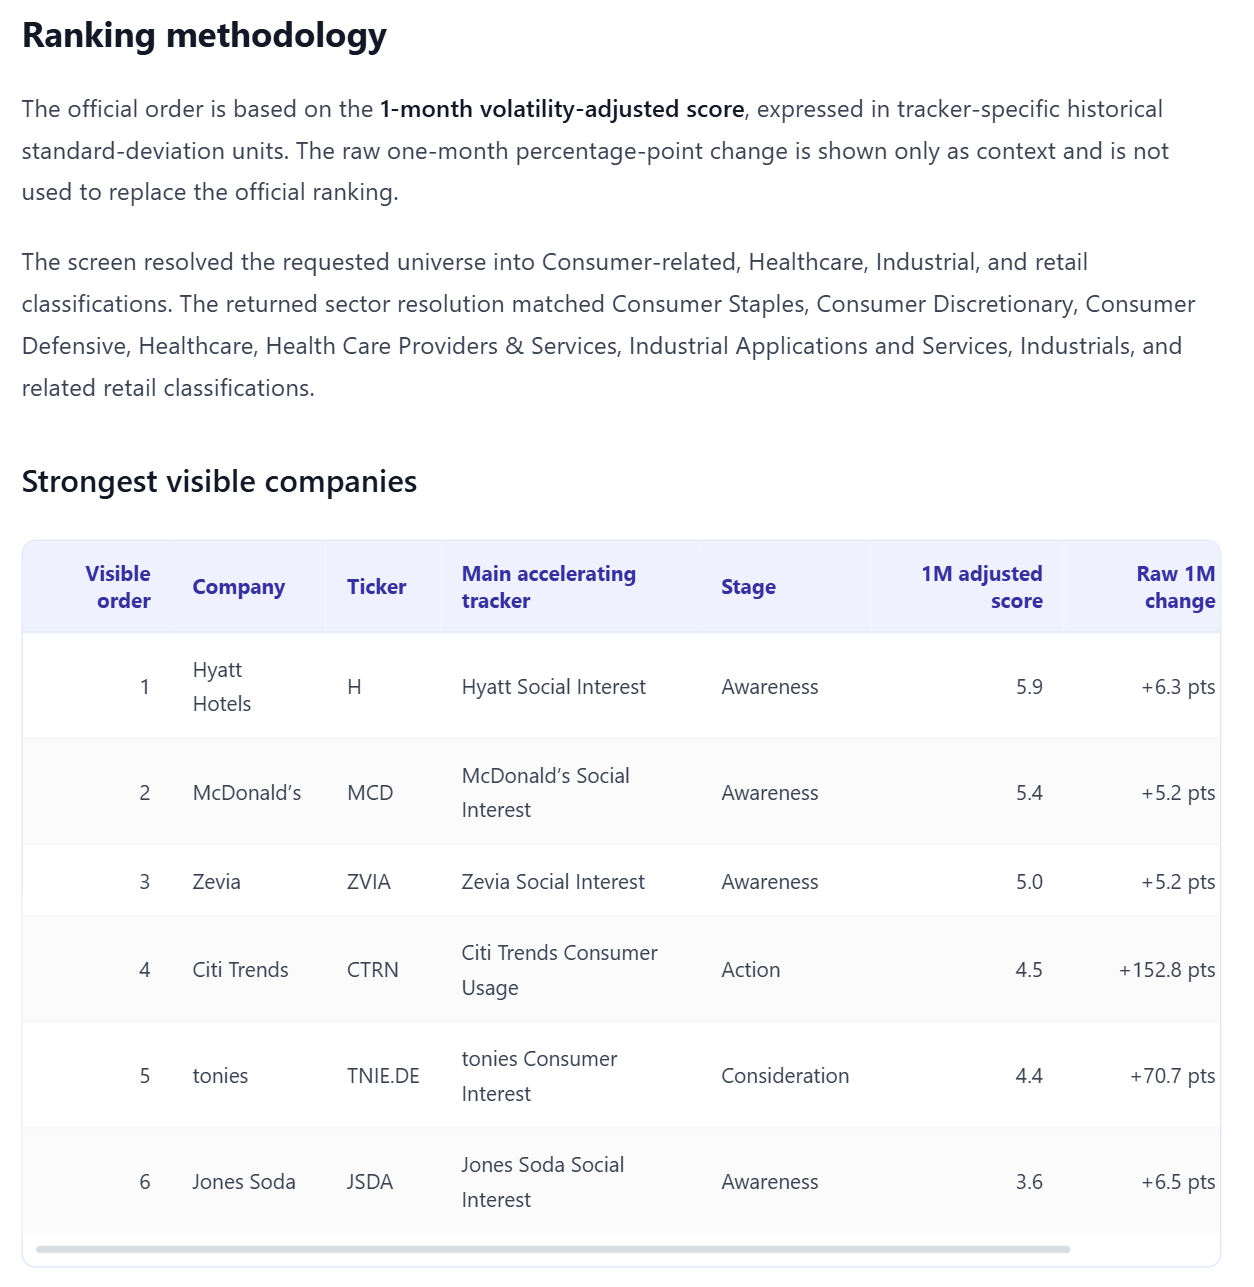
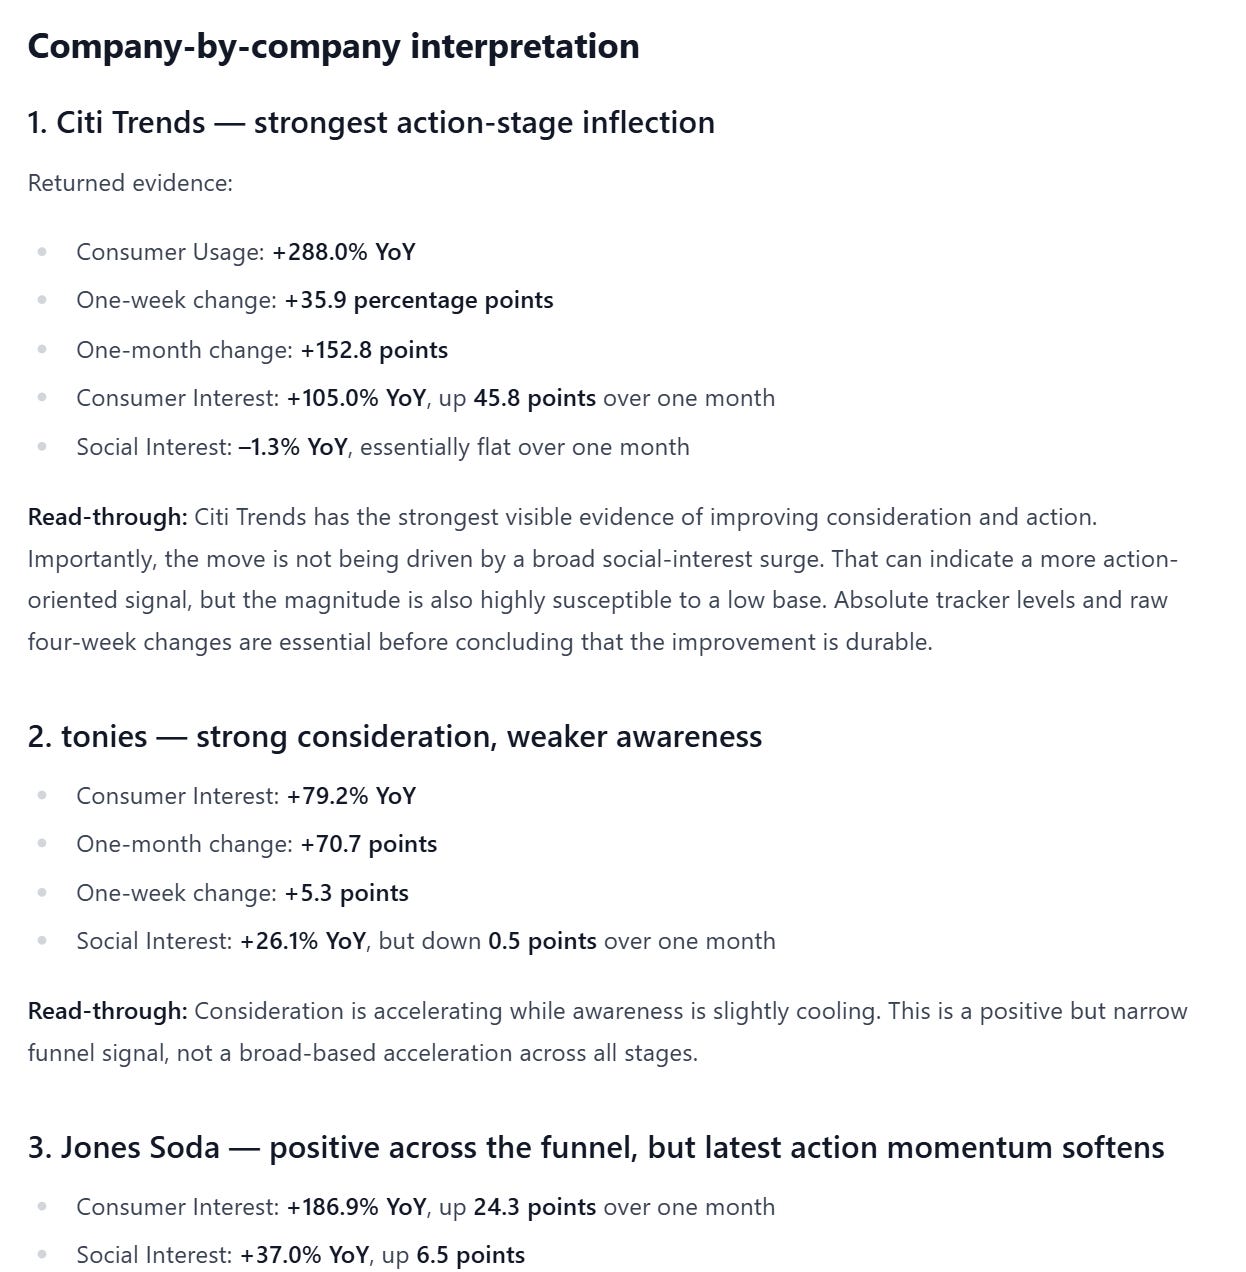
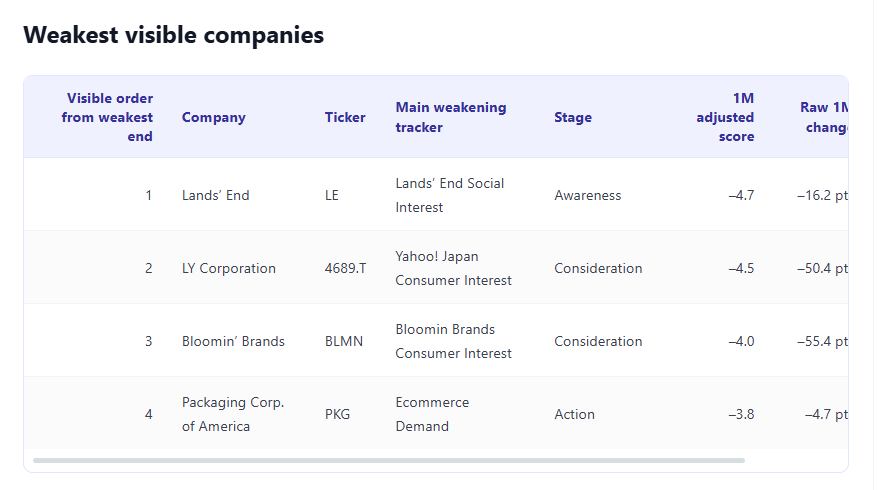
The output returns a ranked list with the metrics behind each ranking, along with company-by-company detail explaining what's driving the movement for both winners and losers. We can set tasks like this to run weekly, so the rankings refresh automatically as values update and companies enter or drop off the list.
What it replaces
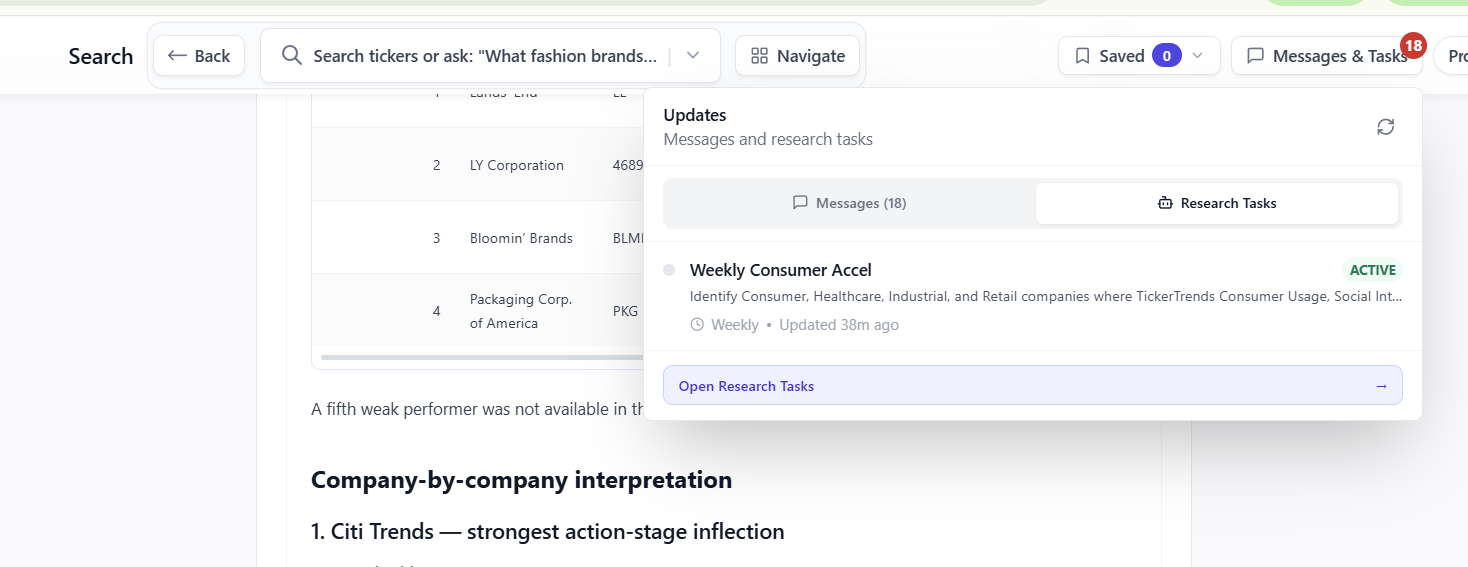
Building a screen like this manually means pulling data across a large ticker universe, normalizing it, ranking it, and writing up the findings. Research Tasks does that from a single instruction, with the underlying data and sourcing included so the output can be checked against the source trackers directly. KPI Tracking Suite users can navigate to the top right of the screen today to try their own task.
Email: admin@tickertrends.io with any questions on this feature or general inquiries.