
Tracking What the Internet Is Talking About: Introducing Discussion Share
A new way to measure attention shifts across topics, brands, and narratives in real time

At TickerTrends, the Discussion Share graph is built to capture something traditional datasets miss entirely: how conversation evolves over time. By analyzing large samples of social content, like TikTok posts, we track the topics mentioned in each post and measure how the share of those discussions shifts across categories.
Instead of asking “how many people use this?”, we ask a different question:
“What is taking up space in the conversation?”
From Posts to Signals
Every post on a platform like TikTok contains signals, what product is being mentioned, what model is being compared, what trend is gaining traction. On their own, these posts are just noise. But when aggregated, they form a clear picture of where attention is moving.
The Discussion Share graph takes this stream of content and organizes it into a time series. Each line (or area) represents a topic, and its share reflects how much of the total conversation it occupies at any given moment.
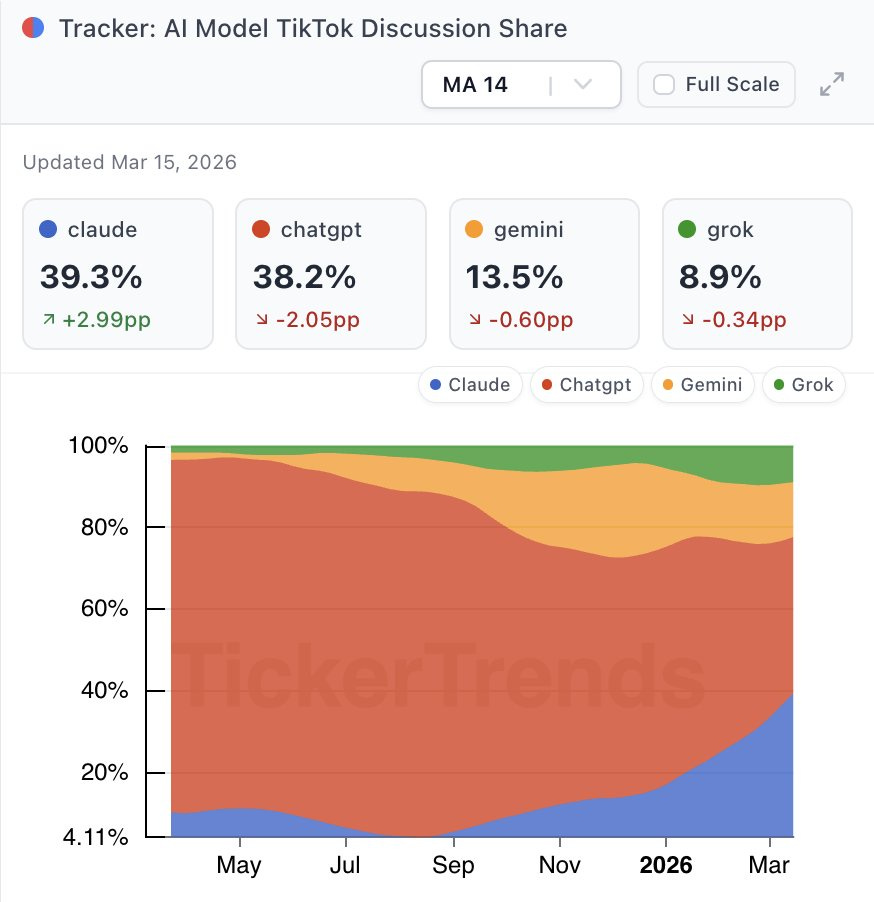
A Real Example: AI Model Discussion on TikTok
When we apply this framework to AI models, the shifts become obvious.
Earlier in the cycle, ChatGPT dominated the conversation. It was the entry point for most users and the center of nearly all AI-related content. But as newer models entered the market, the conversation began to fragment.
What the Discussion Share graph reveals is not just who is leading, but how that leadership changes.
Claude, for example, has steadily gained share in recent months, now slightly surpassing ChatGPT in total discussion. This doesn’t necessarily mean it has more users. It means something different, and arguably more important:
people are talking about it more.
That usually happens when a product feels new, differentiated, or worth sharing.
At the same time, ChatGPT’s share has declined slightly, not because it’s disappearing, but because it’s becoming normalized. As products mature, they often move from being discussed to simply being used.
This is exactly the kind of transition the Discussion Share graph is designed to capture.
Why This Matters
Social platforms like TikTok function as early indicators of interest. They capture:
discovery before adoption
curiosity before conversion
narrative before measurable outcomes
By the time something shows up in revenue or user metrics, the conversation has often already moved.
Discussion Share flips the process. It lets you track where attention is forming in real time, before it becomes consensus.
What People Are Actually Talking About
Within AI, the content itself tends to follow patterns, comparisons between models, tutorials, unexpected outputs, or reactions to new features. But what matters isn’t just the content, it’s which model is consistently at the center of it.
The Discussion Share graph surfaces that dynamic clearly. You can see when one model begins to take over the narrative, when another starts to fade, and when new entrants spike into relevance.
A Better Way to Track Trends
The Discussion Share graph gives you a direct way to measure that conversation, continuously, and at scale.
Whether you’re tracking AI models, consumer brands, or emerging products, the same principle applies:
the topics that dominate discussion today often shape outcomes tomorrow.
For access to the full note and our KPI forecasting platform, please contact admin@tickertrends.io .
TickerTrends Enterprise provides access to tracking and forecasting across 500+ public company KPIs, alongside actionable, data-driven research.
https://tickertrends.io/enterprise