Treendly vs. TickerTrends: The Ultimate Trend Analysis Platform Comparison
If you're choosing between Treendly and TickerTrends, here's the bottom line:
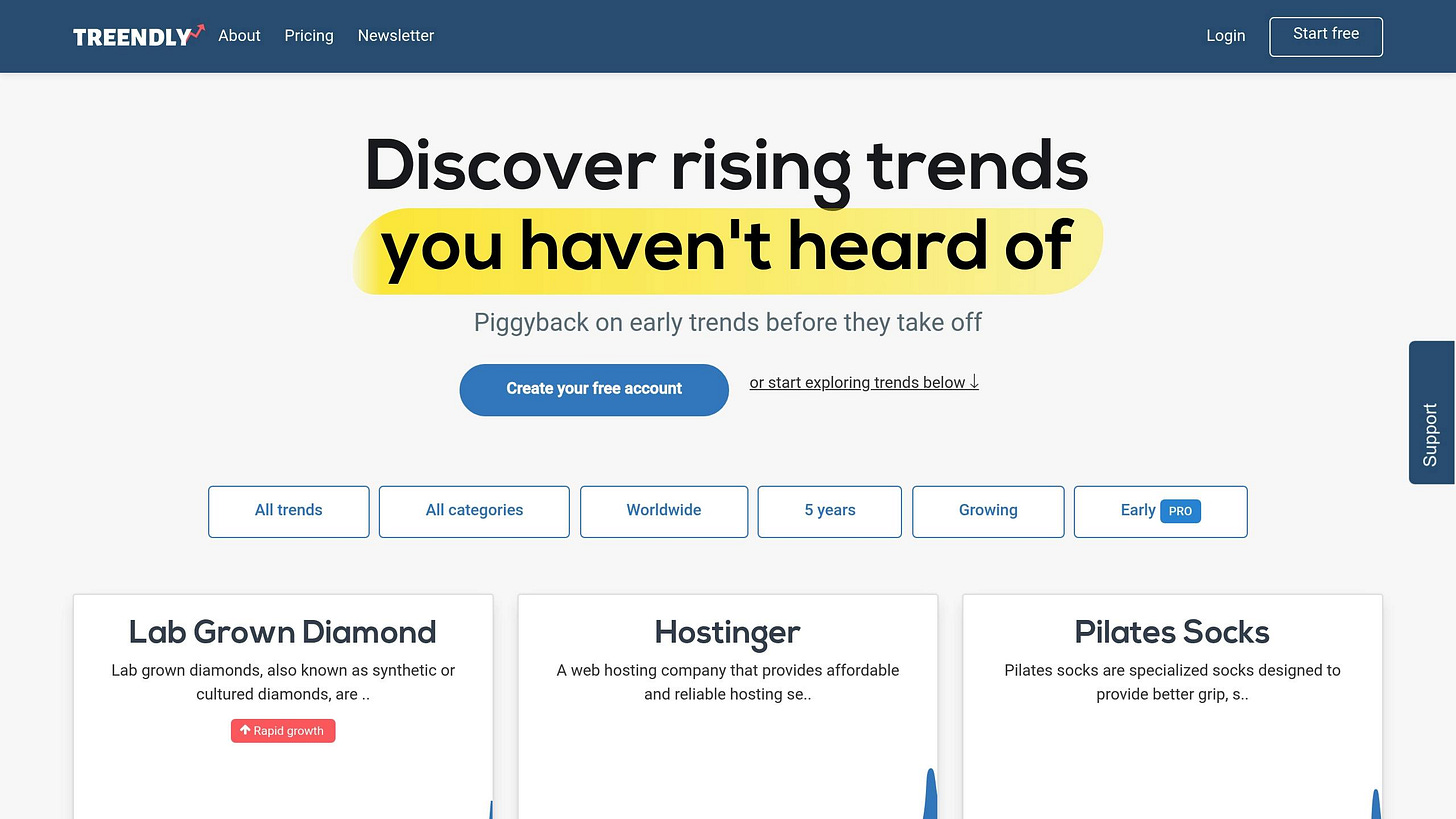
Treendly is great for identifying long-term emerging trends in industries like beauty, food, and lifestyle. It’s affordable (starting at $0/year) and suitable for marketers and general researchers.
TickerTrends is built for investors and analysts seeking real-time alternative data, financial insights, and AI-powered tools. Starting at $19/month, it offers significantly more depth, coverage, and market utility.
Quick Comparison
Treendly:
Focus: Emerging industry trends
User Base: 39,005+ general users
Data Sources: Google, social mentions
Pricing: $0–$99/year
Best For: Niche market discovery
TickerTrends:
Focus: Financial alt-data & stock intelligence
User Base: Professional investors, analysts, funds
Data Sources: Google, TikTok, Reddit, Web traffic, Amazon, YouTube, App data
Pricing: $0–$89/month
Best For: Public company tracking, short-term signals
Verdict: Use Treendly for casual trend exploration. Choose TickerTrends for financial-grade alt-data analysis and actionable insights.
Treendly Platform Overview
Core Features
Treendly is a lightweight trend-spotting platform aimed at creators, entrepreneurs, and marketers. Its tools are designed to surface rising topics in search and social data, with a clean interface and quick alerts.
Notable Features:
Unlimited keyword searches (even on the free plan)
Basic trend alerts and keyword metrics
Email newsletters with trend summaries
Simple reports for content ideation
That said, Treendly lacks integration with public company data, financial analytics, or ticker mapping capabilities.
Pricing Tiers
Free Plan ($0/year):
1 trend alert
Limited trend library
1 user seat
Pro Plan ($99/year):
25 trend alerts
Full trend library
4 user seats
Enterprise Plan (Custom Pricing):
API access
Custom reports
10+ user seats
TickerTrends Platform Overview
Why TickerTrends Dominates for Investors
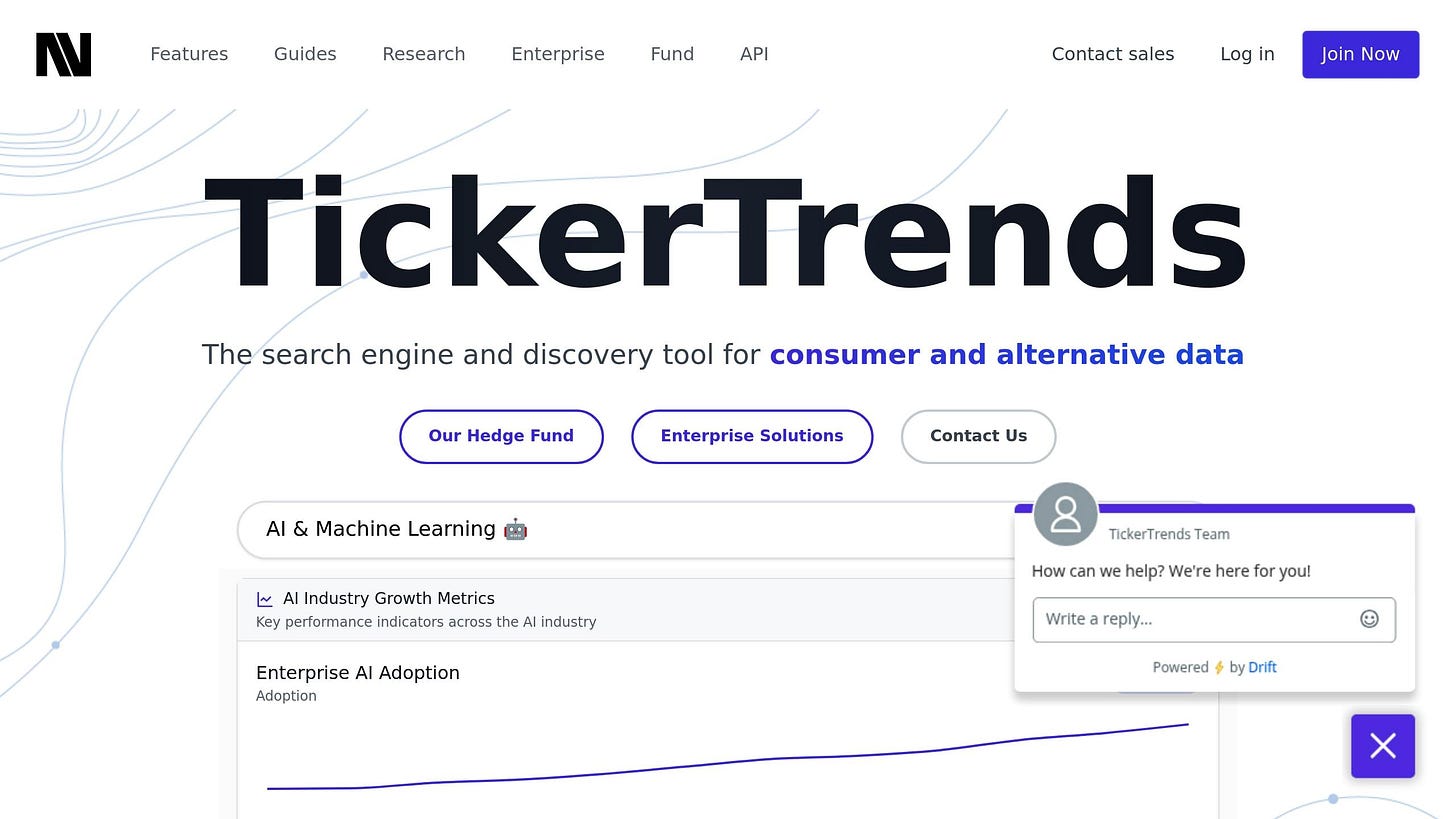
TickerTrends is an enterprise-grade platform for alternative data. It specializes in identifying, scoring, and mapping real-time trends directly to financial tickers—making it invaluable for investors, hedge funds, and institutional analysts.
Core Advantages:
Exploding Trends: Tracks rapidly growing keywords across data sources in real time, scoring them by strength, speed, and relevance.
Summary Page: Aggregates everything about a term—trend charts, financial and alternative data, company links, and social buzz—in one place.
AI Keyword-to-Ticker Mapping: Proprietary embeddings auto-match terms with 25,000+ stocks using contextual and historical associations.
Enterprise Dashboards: Collaborative tools for teams to share watchlists, trends, alerts, and dashboards.
Custom Trend Scoring: Multi-factor analysis of velocity, sentiment, volume, and relevance.
Data Source Coverage
Google Search: 5 years of history, updated bi-weekly
Web Traffic: 25 months of history, updated bi-weekly
TikTok Mentions: 3 years of history, updated weekly
Reddit Posts: 1+ year of history, updated weekly
YouTube Search: 5 years of history, updated bi-weekly
Amazon Search Trends: 16 months of history, updated monthly
Mobile App Metrics: 25 months of history, updated bi-weekly
All data is normalized, processed, and indexed to compare keyword performance across companies and categories.
Exploding Trends: The Alpha Edge
TickerTrends' Exploding Trends identifies fast-emerging topics before they hit Wall Street radar. Using Google velocity, Reddit buzz, TikTok spikes, and search traffic, the platform surfaces actionable signals.
Use Cases:
Spotting early-stage consumer brand momentum
Tracking viral products or terms before they impact revenue
Capturing sentiment-driven stock moves from social media
Example: A trending TikTok skincare product triggers a keyword spike. TickerTrends detects this, maps it to the public parent company, and updates dashboards in real time.
Plans & Pricing
Free Plan ($0/month):
Basic ticker access
Pro Plan ($19/month):
Google Trends and Web Traffic data
Access to 25,000+ stocks
Max Plan ($89/month):
Full access to all alt-data types
5-year historical coverage
Up to 10 simultaneous chart views
Enterprise Plan (Custom Pricing):
Access to Gen AI Trend Lab
Unlimited dashboards and alerts
API access and team collaboration tools
Treendly vs. TickerTrends: Head-to-Head
Data Quality
Treendly: Surface-level keyword tracking
TickerTrends: Full-context alternative data with historical benchmarks and AI-mapped relevance
Ideal Users
Treendly: Content creators, brand marketers, SEO strategists
TickerTrends: Hedge funds, equity researchers, quant analysts, trading teams
Alerts and Trend Discovery
Treendly: Simple email alerts
TickerTrends: Exploding Trends dashboard, ranked signals, and real-time mapping to financial markets
Conclusion
Treendly:
Best For: Niche trend tracking
Pros: Free access, simple UI, ideal for marketers
Cons: No financial data, limited analytics
TickerTrends:
Best For: Financial trend analysis
Pros: AI-powered insights, multi-source alt-data, real-time alerts, institutional-grade tools
Cons: Paid subscription required
Final Verdict
Use Treendly if you're looking for a basic tool to find interesting content ideas or track broad market themes.
Choose TickerTrends if you’re serious about investing, tracking companies, or generating alpha from alternative data. It’s not just a trend tracker—it’s a high-performance insight engine for professionals.
"Exploding Trends gave me the heads-up on a microcap before the crowd caught on. I closed my position +27% in two days." — Max, TickerTrends Pro user


