
We Knew What Was Coming: How This KPI Data Predicts Market Winners (Are You Missing Out?)
The TickerTrends Social Arbitrage Hedge Fund is currently accepting capital. If you are interested in learning more send us an email admin@tickertrends.io


At TickerTrends, we're dedicated to equipping traders and investors with a decisive edge by providing one of a kind detailed Key Performance Indicator (KPI) analysis for publicly traded companies. Our platform meticulously tracks a wide array of metrics, juxtaposing our proprietary predictions against actual reported numbers to transparently assess forecasting accuracy. This article offers an expanded look into how our granular KPI dashboards can be powerfully leveraged for trading decisions. For the purpose of this article we will cover Hims & Hers Health, Inc. ($HIMS), Uber Technologies, Inc. ($UBER), and The New York Times Company ($NYT). We will break down the most important KPI metrics for these companies, exhibiting how our platform can help with analysis of these companies and potential inferences can be drawn.
Hims & Hers Health, Inc. ($HIMS):
Subscribers (End of Period):
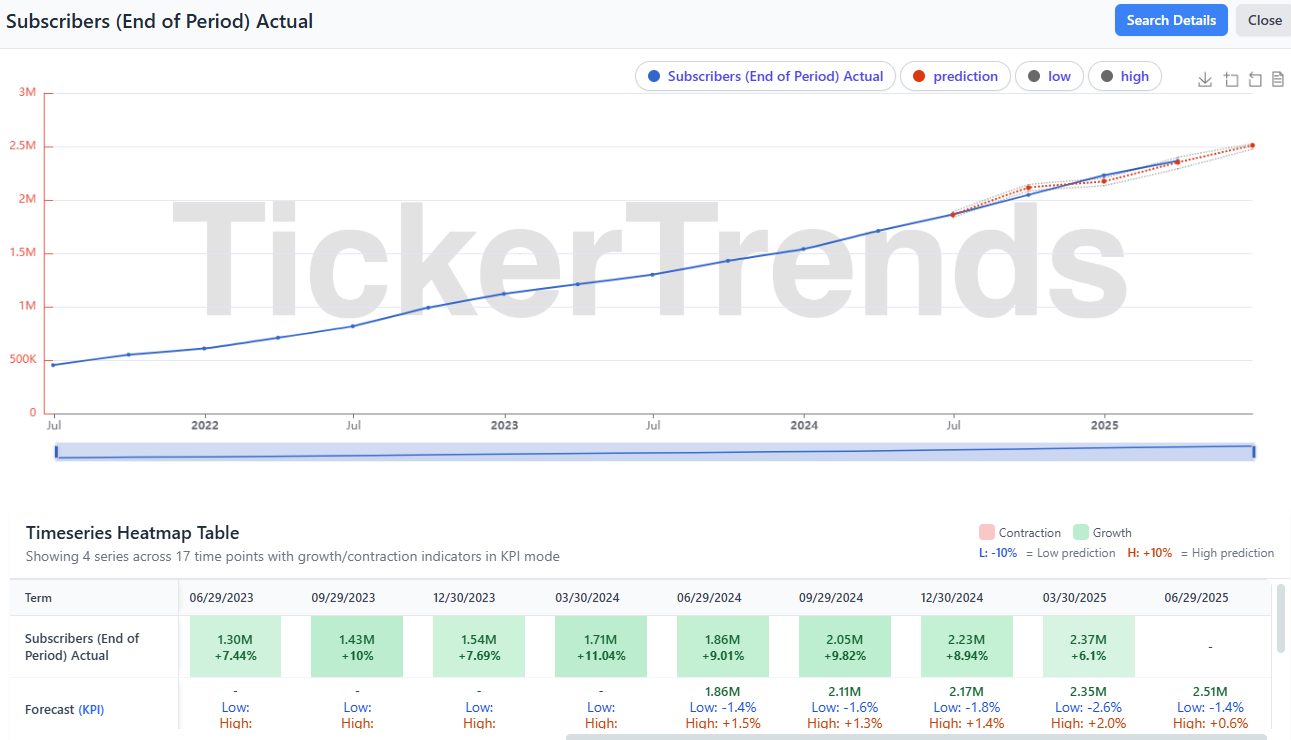
The lifeblood of Hims & Hers is its subscriber base. Our "Subscribers (End of Period) Actual" chart tracks this critical metric over time, comparing actual figures to TickerTrends' proprietary forecasts, which include 'low' and 'high' prediction bands. For instance, HIMS reported 1.86M subscribers for Q2 2024, which our platform predicted perfectly. Our proprietary models suggests a continuation of this strong growth trajectory. As of today we predict Hims’ subscriber base to be 2.37M with a tight low prediction of -1.4% and a high of +0.6%.
Other Metrics:

Prop Trend:
The "prop trend" chart is a unique offering from TickerTrends, displaying a trend line based on our proprietary algorithms. This trend is distinct from simple price or volume trends.
The direction and slope of the prop trend offer an alternative lens on the stock's underlying momentum or sentiment as interpreted by TickerTrends' technology. An upward-sloping prop trend, for example, would generally be seen as positive. Traders might look for confirmations or divergences: if the prop trend is rising while subscriber growth is also strong, it reinforces a bullish outlook. Conversely, if the prop trend starts to decline despite positive news, it might warrant further investigation.
Positive/Negative News Sentiment:
Our dashboard includes a chart that visualizes the volume and sentiment (categorized as positive, negative, or neutral) of news articles concerning HIMS over a four year period.
This chart provides a quantifiable measure of media perception. A sustained period where positive news significantly outweighs negative news can build investor confidence and attract buying interest. Conversely, a sudden spike in negative news volume, or a consistent downtrend in positive coverage, could foreshadow increased selling pressure or highlight emerging risks. Traders can use this to gauge the prevailing narrative around the stock. Hims started to see an increase in positive coverage in the first half of 2024 which could have predicted that the company is gaining mindshare and might see revenue growth.
Search Trends:
The "trend" chart reflects the search interest for HIMS over time, derived from search activity. Rising search trends can be a leading indicator of increasing brand awareness, consumer curiosity, or intent to purchase, which could translate into future subscriber growth. A sustained increase in search volume is generally positive. Conversely, a consistently declining search trend might suggest waning public interest or market saturation, potentially acting as an early warning for slowing growth.
Reddit Mentions:
This KPI tracks the volume of mentions of HIMS on Reddit, offering a glimpse into retail investor sentiment and discussion frequency. Significant spikes in Reddit mentions, especially if correlated with positive sentiment (though direct sentiment isn't shown, volume indicates engagement), can sometimes precede increased stock volatility or highlight a growing focus from potential customers or investors. While not a standalone trading signal, it can be a useful component of a broader social sentiment analysis.
Web Traffic:
The web traffic data for Hims provides insights into the activity on its online platform. The heatmap shows weekly web traffic indices. Web traffic can serve as a proxy for customer engagement and potential conversions (new subscribers). An upward trend in web traffic is generally a positive sign. Consistent declines or stagnation in web traffic could be a concern if the trend persists, possibly indicating reduced marketing effectiveness or lower interest.
Android & iOS App Usage:
We track usage data for both the HIMS Android app and iOS app. App usage is a direct measure of customer engagement with HIMS' services on mobile platforms. Growing usage typically indicates an active and potentially expanding subscriber base. The Android and iOS usage has started to flatline, if this ends up being a continuing trend, it could be a bearish signal, suggesting lower engagement or even subscriber churn. Investors should look for sustained trends rather than single data points.
Uber Technologies, Inc. ($UBER)
Monthly Active Consumers (MACs) Actual & Forecast:
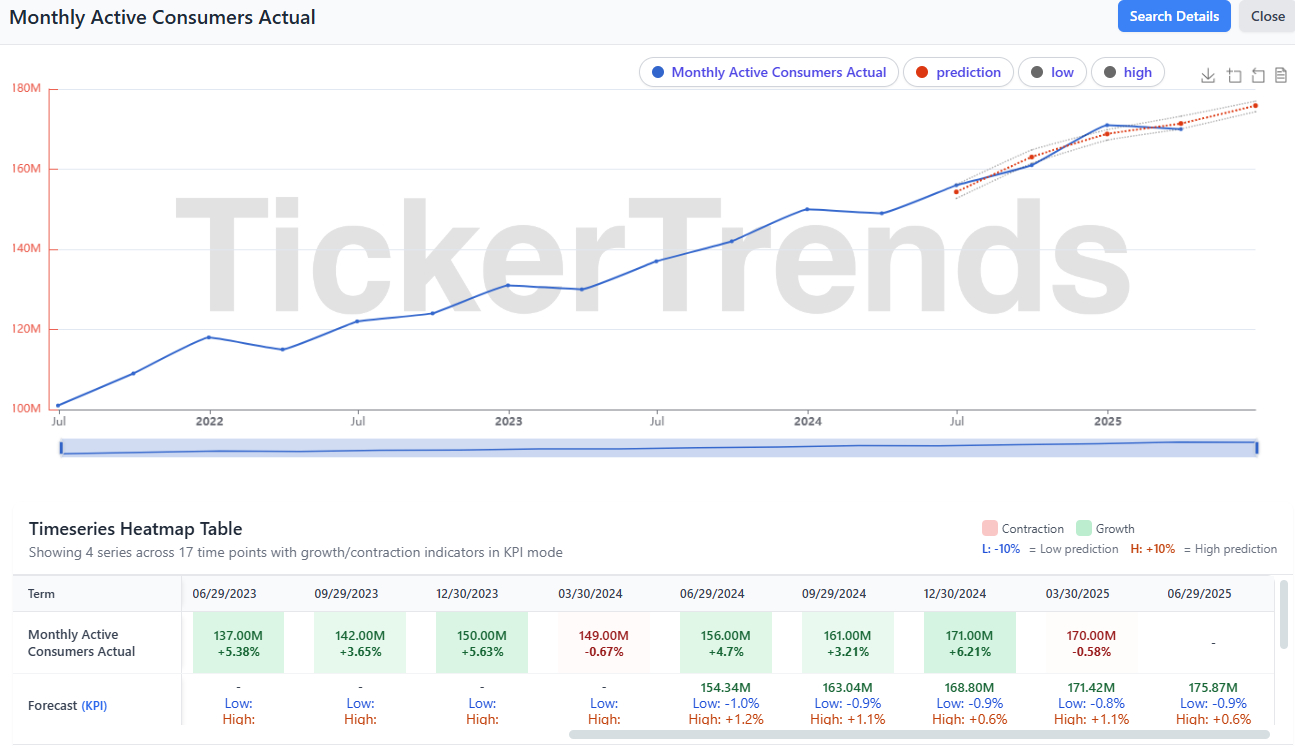
For Uber, Monthly Active Consumers (MACs) are a cornerstone KPI. Our "Monthly Active Consumers Actual" chart displays historical MACs against TickerTrends’ predictions. Uber reported 170.00M MACs for the period ended December 31, 2024 against our prediction of $171.42 (within a low forecast of -0.8% and a high of +1.1% from the central estimate) and projects 175.87M for the period ended June 29, 2025 as of time of writing.
Consistent MAC growth is fundamental to Uber's success. The upward trend and our forecasts suggest continued expansion. Investors will keenly watch if actual MACs align with or surpass our predictions. The relatively narrow forecast bands (e.g., for 06/29/2024) indicate a degree of model confidence.
Other Metrics:

Positive/Negative News Sentiment:
This chart breaks down news coverage related to Uber into positive, negative, and neutral sentiments over time. We are witnessing the positive news index surging in April and May. A dramatic spike in positive news could potentially be attributed to the Waymo partnership which is forming a positive narrative about the product and could lead to a strong earnings report.
Web Traffic:
We monitor web traffic for Uber's online platforms. Increased web traffic can suggest heightened consumer interest, potentially leading to more ride bookings or food orders, and can be a precursor to MAC growth. Consistent upward trends are positive. The index can vary substantially making it important to look at longer-term trends rather than isolated weekly figures.
Android & iOS App Usage:
Usage data for Uber's Android app is a key indicator of direct user engagement. As a mobile-centric service, app usage is critical to gauge earnings for Uber. Significant increases could be bullish for earnings. Similarly, we also track usage for Uber's iOS app. A noted decrease in would be a point of concern if sustained, as it could indicate declining engagement within a significant user segment.
The New York Times Company ($NYT):
Digital Only Subscribers 3mo Actual & Forecast:
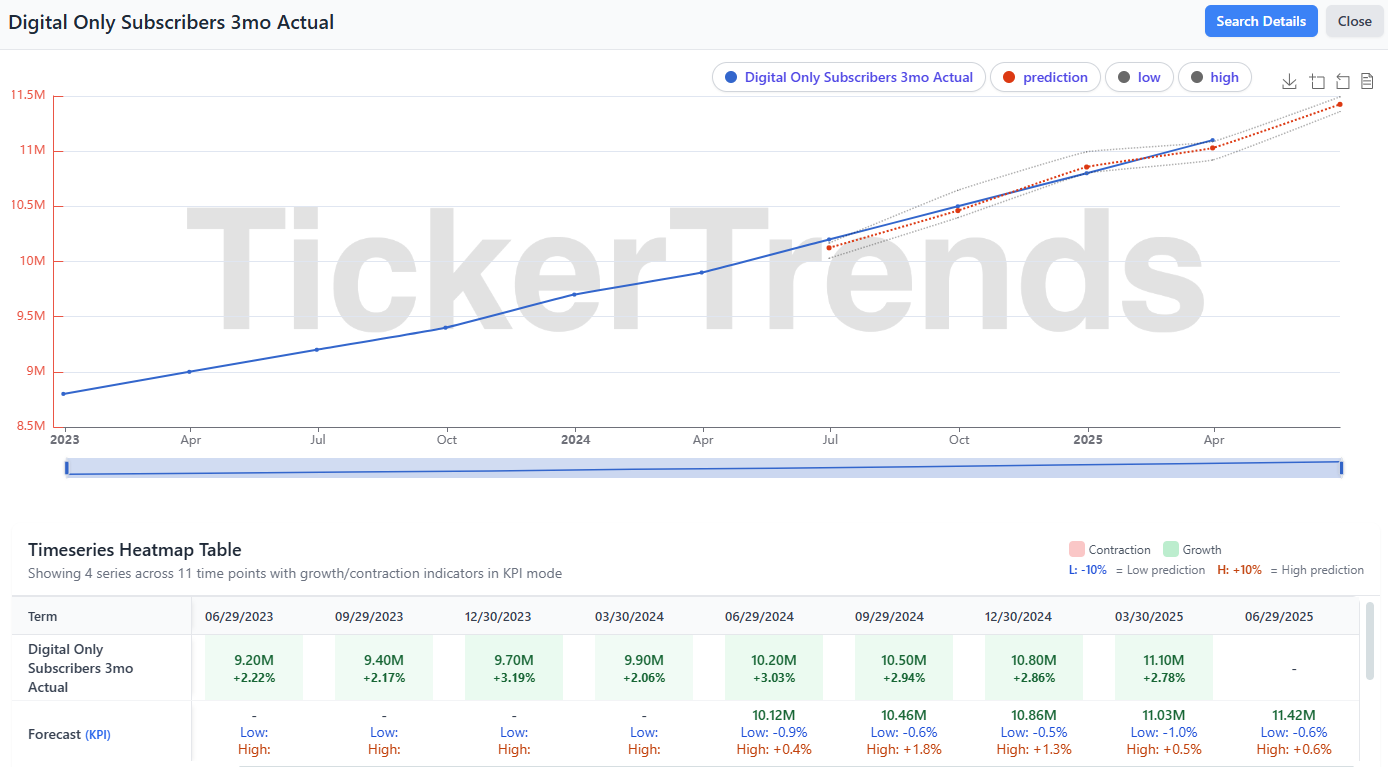
For The New York Times, the growth of "Digital Only Subscribers" is a primary indicator of its strategic success in the digital era. The company reported 11.10M digital-only subscribers for the period ended March 2025 against our projection of 11.03M (within a tight forecast band of Low -1.05%, High +0.5%). This KPI is central to NYT's valuation. Consistent growth in digital subscribers, especially if it meets or exceeds forecasts, is highly positive. The very narrow forecast band for June 2025 (Low -0.6%, High +0.6%) suggests the model's high degree of confidence in the prediction.
Other Metrics:

Prop Trend:
The TickerTrends "prop trend" for NYT offers a proprietary view of its underlying momentum. A stable prop trend suggests consistent underlying business momentum according to TickerTrends' analytical model. Traders and investors would typically compare this with other indicators like price action, subscriber growth, and market sentiment. A flat trend amidst positive news might suggest the news is already priced in, while a rising trend could indicate strengthening fundamentals.
By meticulously tracking these diverse KPIs and understanding their nuanced implications, TickerTrends aims to provide more comprehensive framework for making informed investment decisions. The interplay of these metrics, rather than any single indicator in isolation, often paints the most accurate picture of a company's health and prospects.
Search Trends and Website Traffic:
The "trend" chart and the “web traffic” charts reflects the search interest for New York Time over time, derived from search activity. Rising search trends can be a leading indicator of increasing brand awareness, consumer curiosity, engagement, which could translate into future subscriber growth. A sustained increase in search volume and web traffic is generally positive. Conversely, a consistently declining traffic might suggest waning public interest or market competition or switch to LLMs, potentially acting as an early warning for slowing growth.
App Usage Data:
Usage data for NYT's Android app and iOS app are a key indicator of direct user engagement. App usage is critical for the company and should be monitored closely. The recent trends show a dwindling interest and could be an early sign of slowing momentum.
Don't Miss the Signals:
The detailed KPI analysis presented above for $HIMS, $UBER, and $NYT is just a glimpse into the powerful, granular insights TickerTrends provides. In today's fast-paced market, having access to proprietary forecasts, alternative data trends, and precise KPI tracking is no longer a luxury—it's a necessity for maintaining a competitive edge.
Hedge Funds and Institutional Investors: Are you equipped to catch the subtle shifts in subscriber growth, app engagement, web traffic, and market sentiment before they become common knowledge? Our platform is designed to help you identify emerging opportunities and potential risks with unparalleled clarity.
Stop navigating the markets with incomplete data. Start leveraging the comprehensive intelligence of TickerTrends.
To gain access to our full KPI dashboard, explore our extensive company coverage, and understand how our predictive analytics can be tailored to your specific needs, contact us today.
Email us at admin@tickertrends.io for enquiries and to unlock the TickerTrends advantage.